Diagnostic logging
Overview
Issues detected on the VDAs (such as message queue quota exceedance) can be sent to the Session Recording service as diagnostic logs for display.
Note:
Diagnostic logging is available and enabled by default with Session Recording 2411 and later.
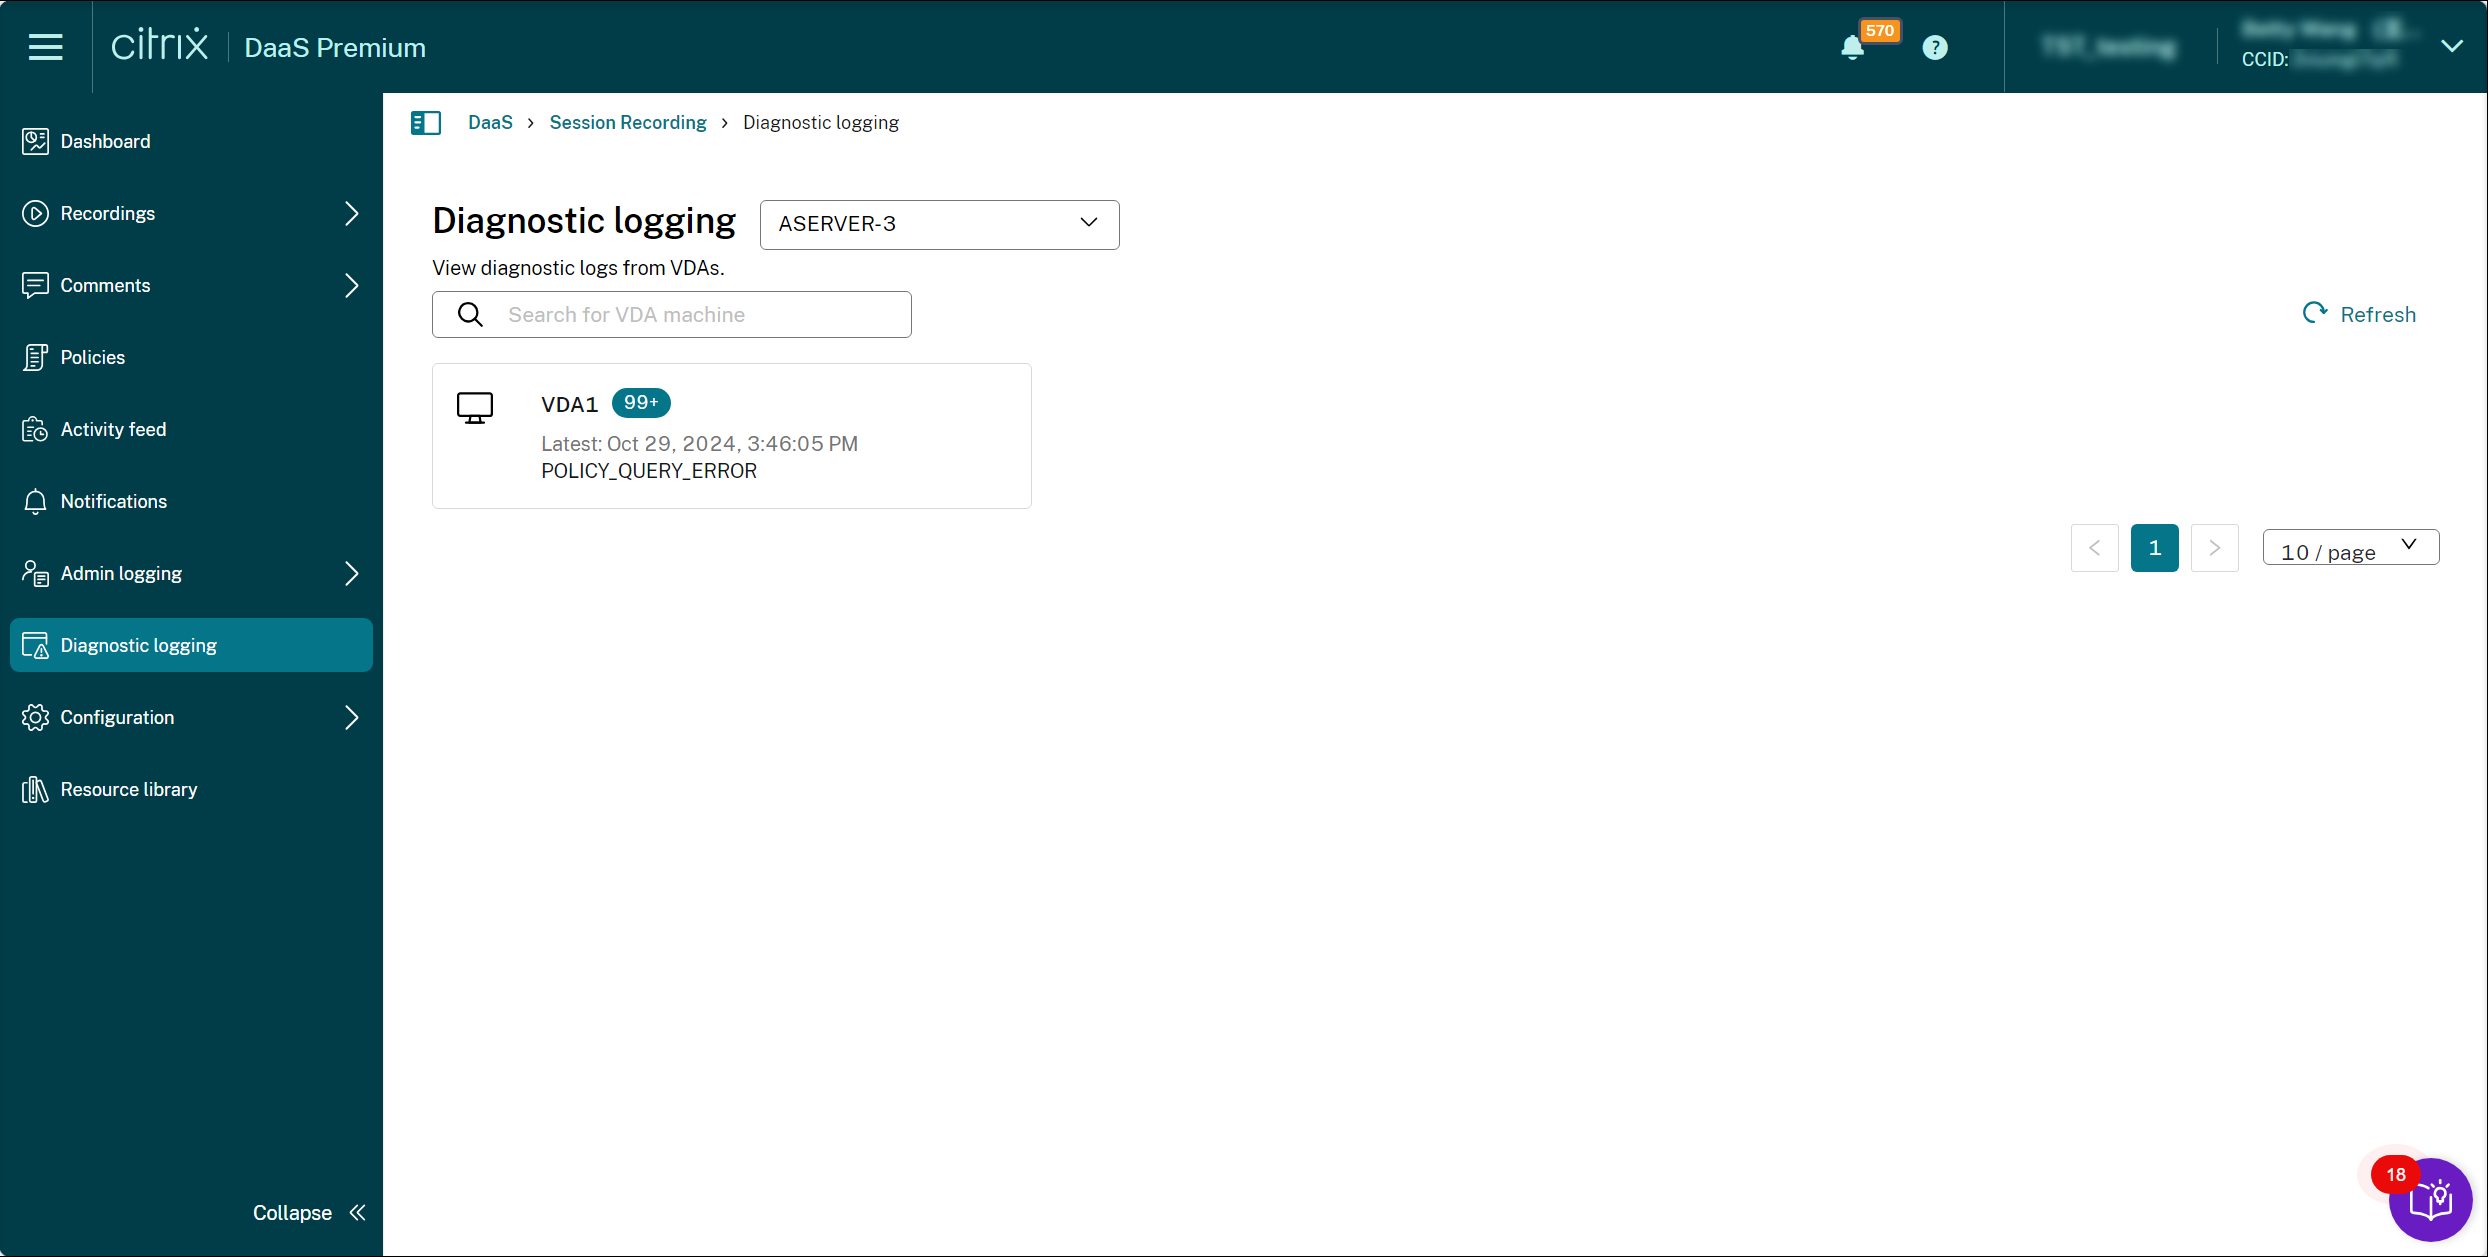
For an example diagnostic logging view, see the following screen capture:
Message queue quota exceedance
In any of the scenarios outlined below, there’s a chance of exceeding the maximum size of the Microsoft Message Queuing (MSMQ) directory on a VDA, resulting in packet drops or pushback.
- On the VDA side, the incoming rate of Message Queuing messages exceeds the outgoing rate.
- The network connection between the VDA and the Session Recording server is poor and thus messages are stuck in the queue on the VDA side.
- The queue quota on the Session Recording server side is used up and messages are stuck in the queue on the VDA side.
Configuration
Diagnostic logging is enabled by default. You can disable and re-enable the feature by using the following registry value on the target VDA:
HKEY_LOCAL_MACHINE\SOFTWARE\Citrix\SmartAuditor\Agent\DiagnosticLoggingEnabled
Value data: 1 = enabled, 0 = disabled
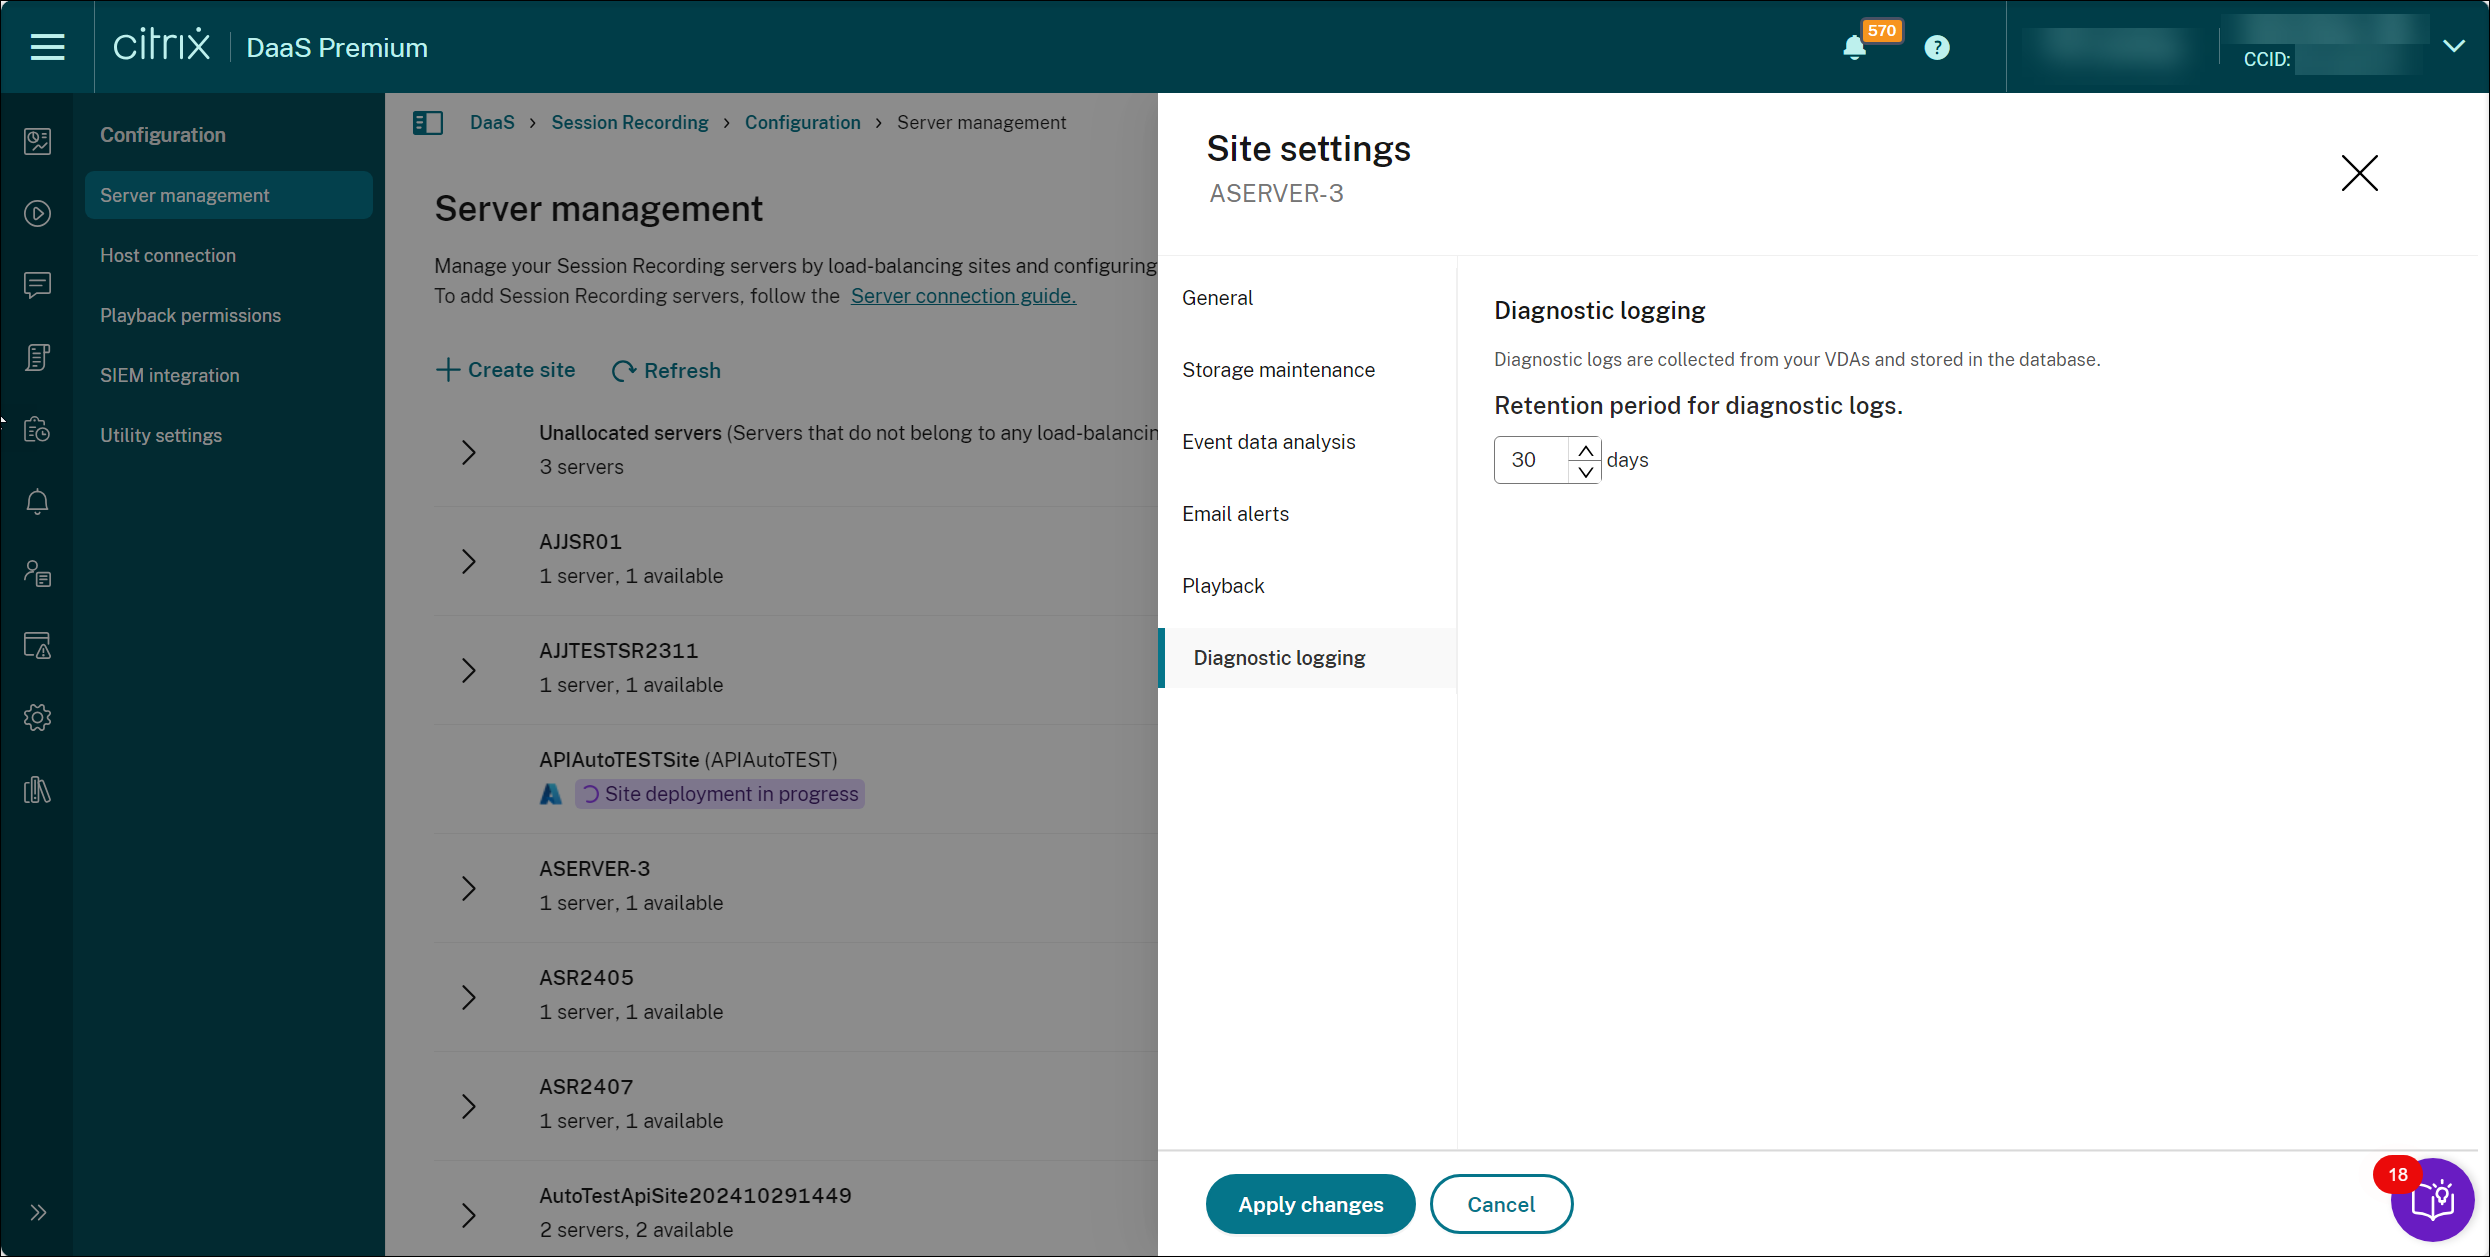
You can also set how long these logs can be retained on the Session Recording database. To do so, go to the site settings for the target site and configure the retention period for diagnostic logs. The default value is 30 days.
View diagnostic logging
- Sign in to Citrix Cloud.
- In the upper left menu, select My Services > DaaS.
- In the DaaS tile, scroll down in the left navigation pane and select Session Recording. You can hover over and pin the Session Recording menu to the top PINNED section of the navigation pane for quick access. You can reorder pinned menus by dragging them to the desired places.
-
In the Session Recording service view, select Diagnostic logging from the left navigation.
All VDAs with diagnostic logs are presented and sorted by their total log counts. You can also view the time the latest log is generated on each VDA and click Refresh to check for more incoming logs.
-
Click a target VDA to view its diagnostic logs.
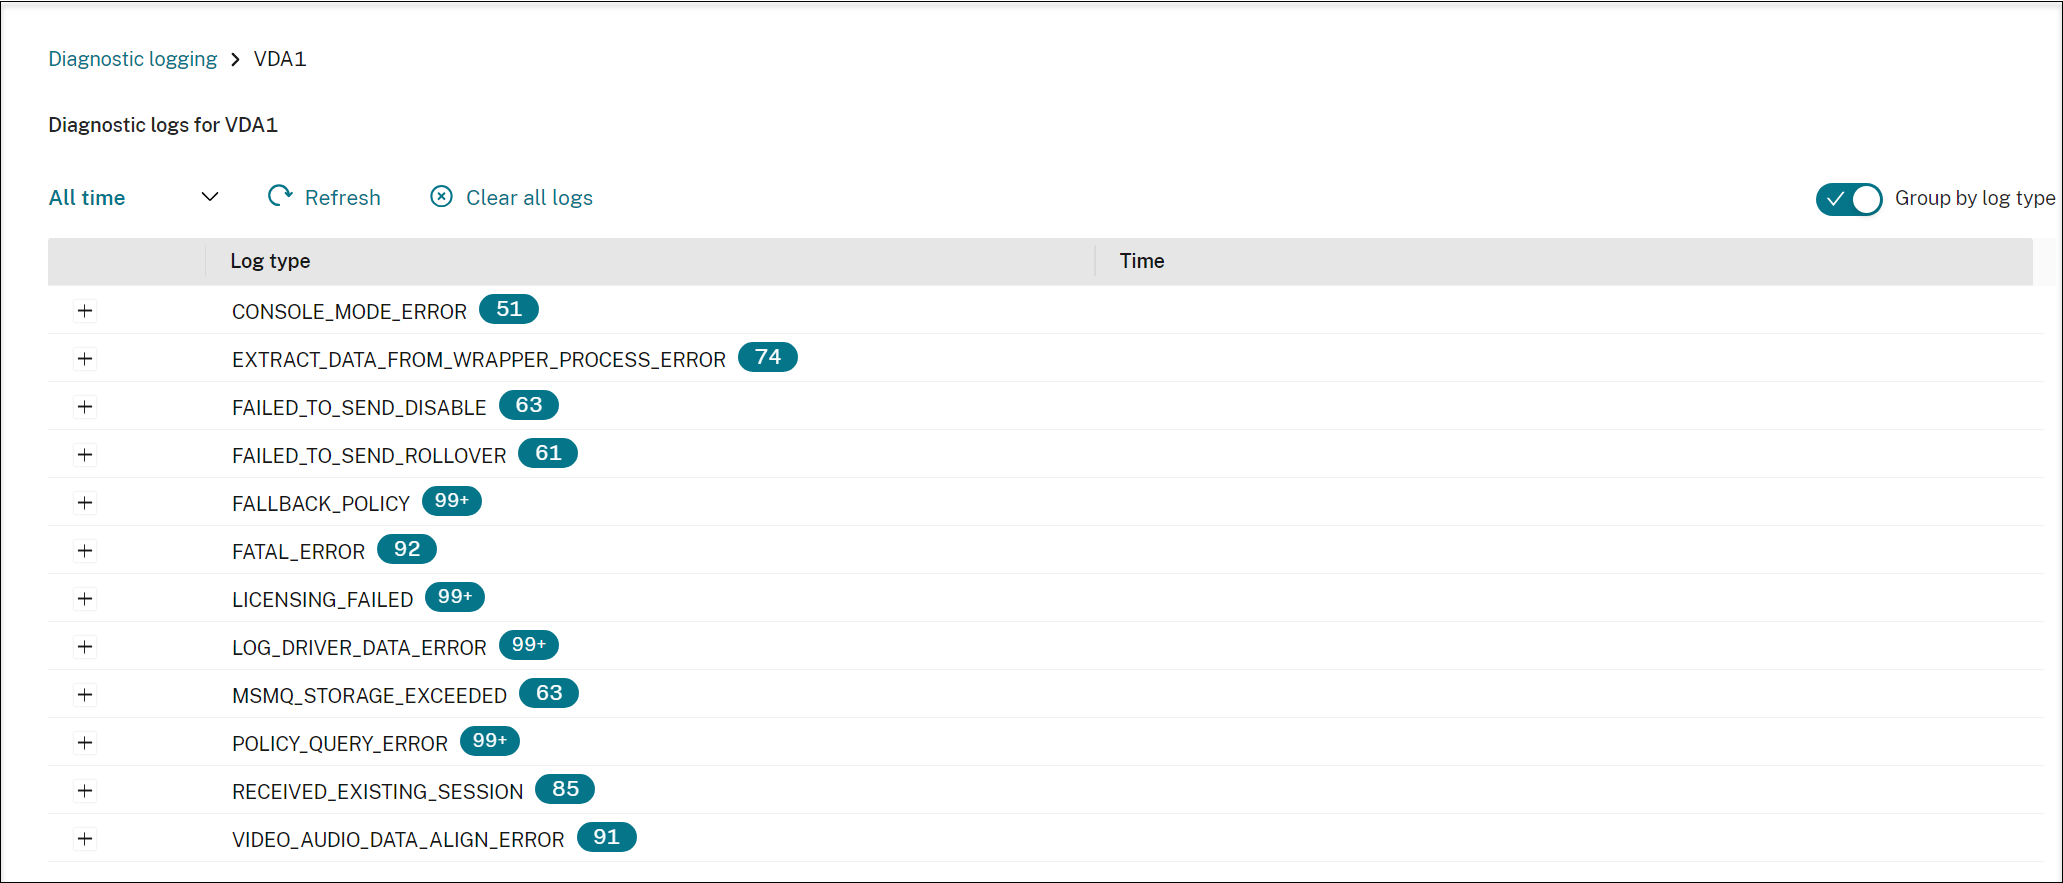
By default, logs are grouped by type. For example:
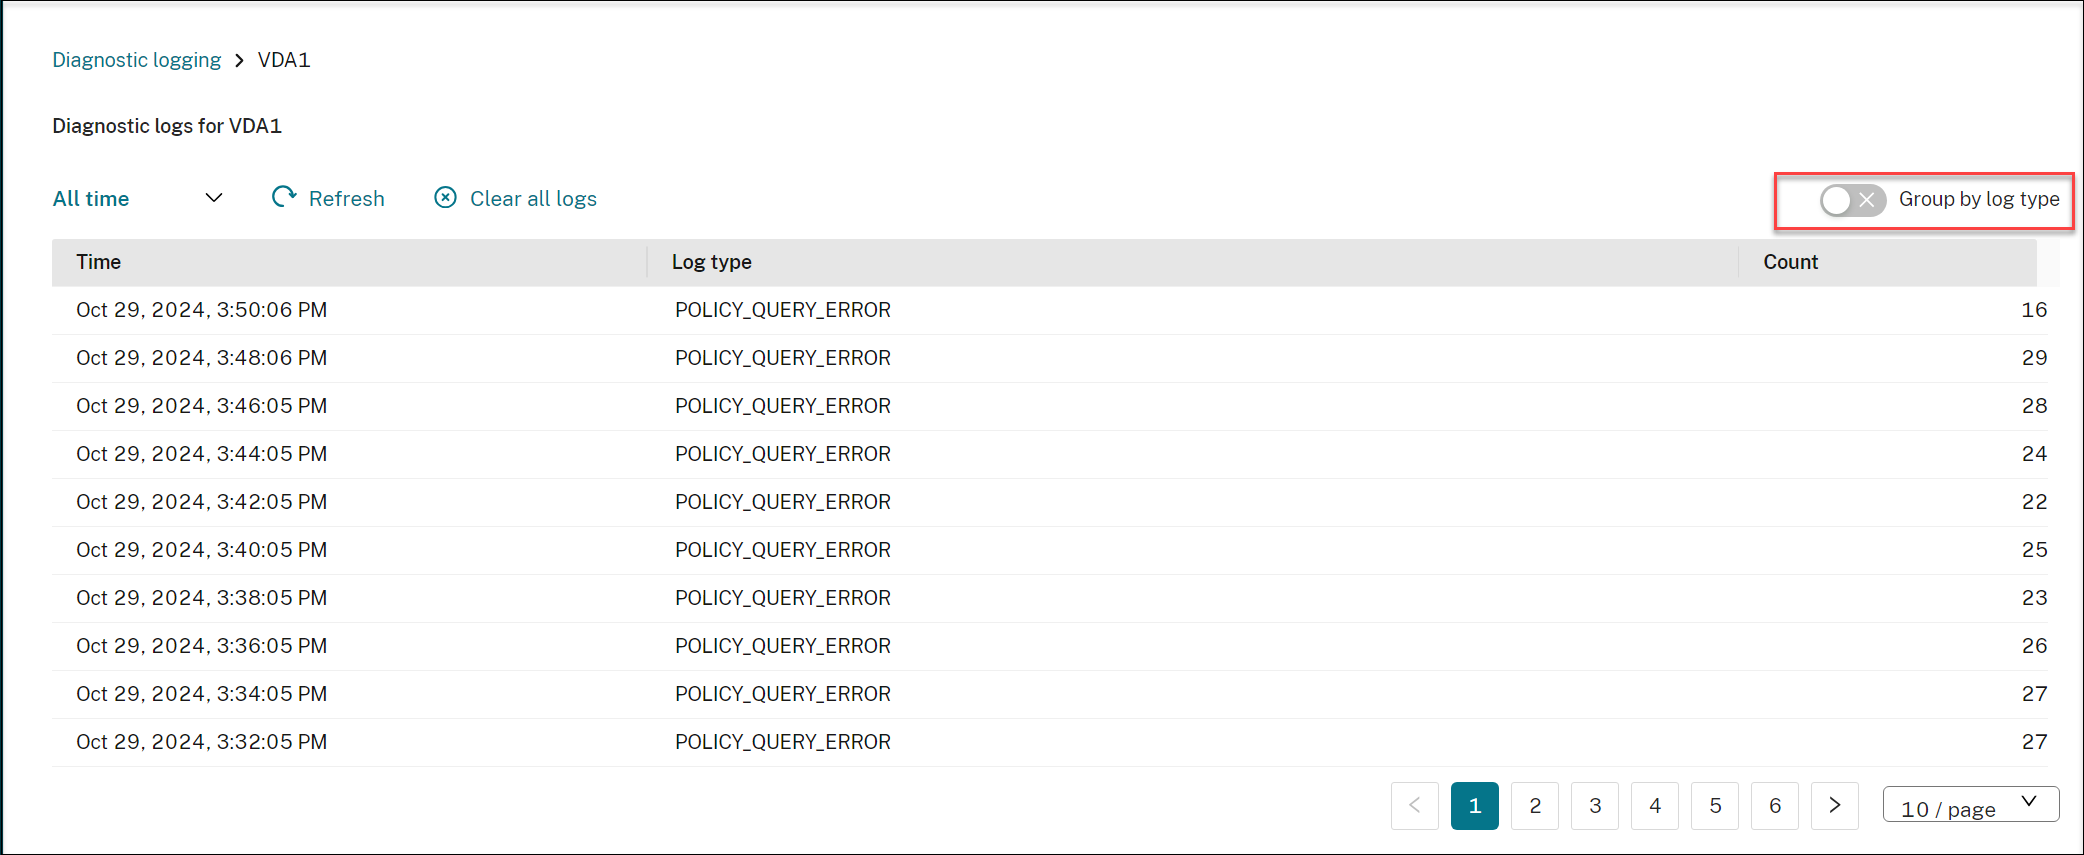
You can disable log grouping by type and list all logs in chronological order instead.
For example:
-
Use the time filter to select and view logs generated during the specified time frame.
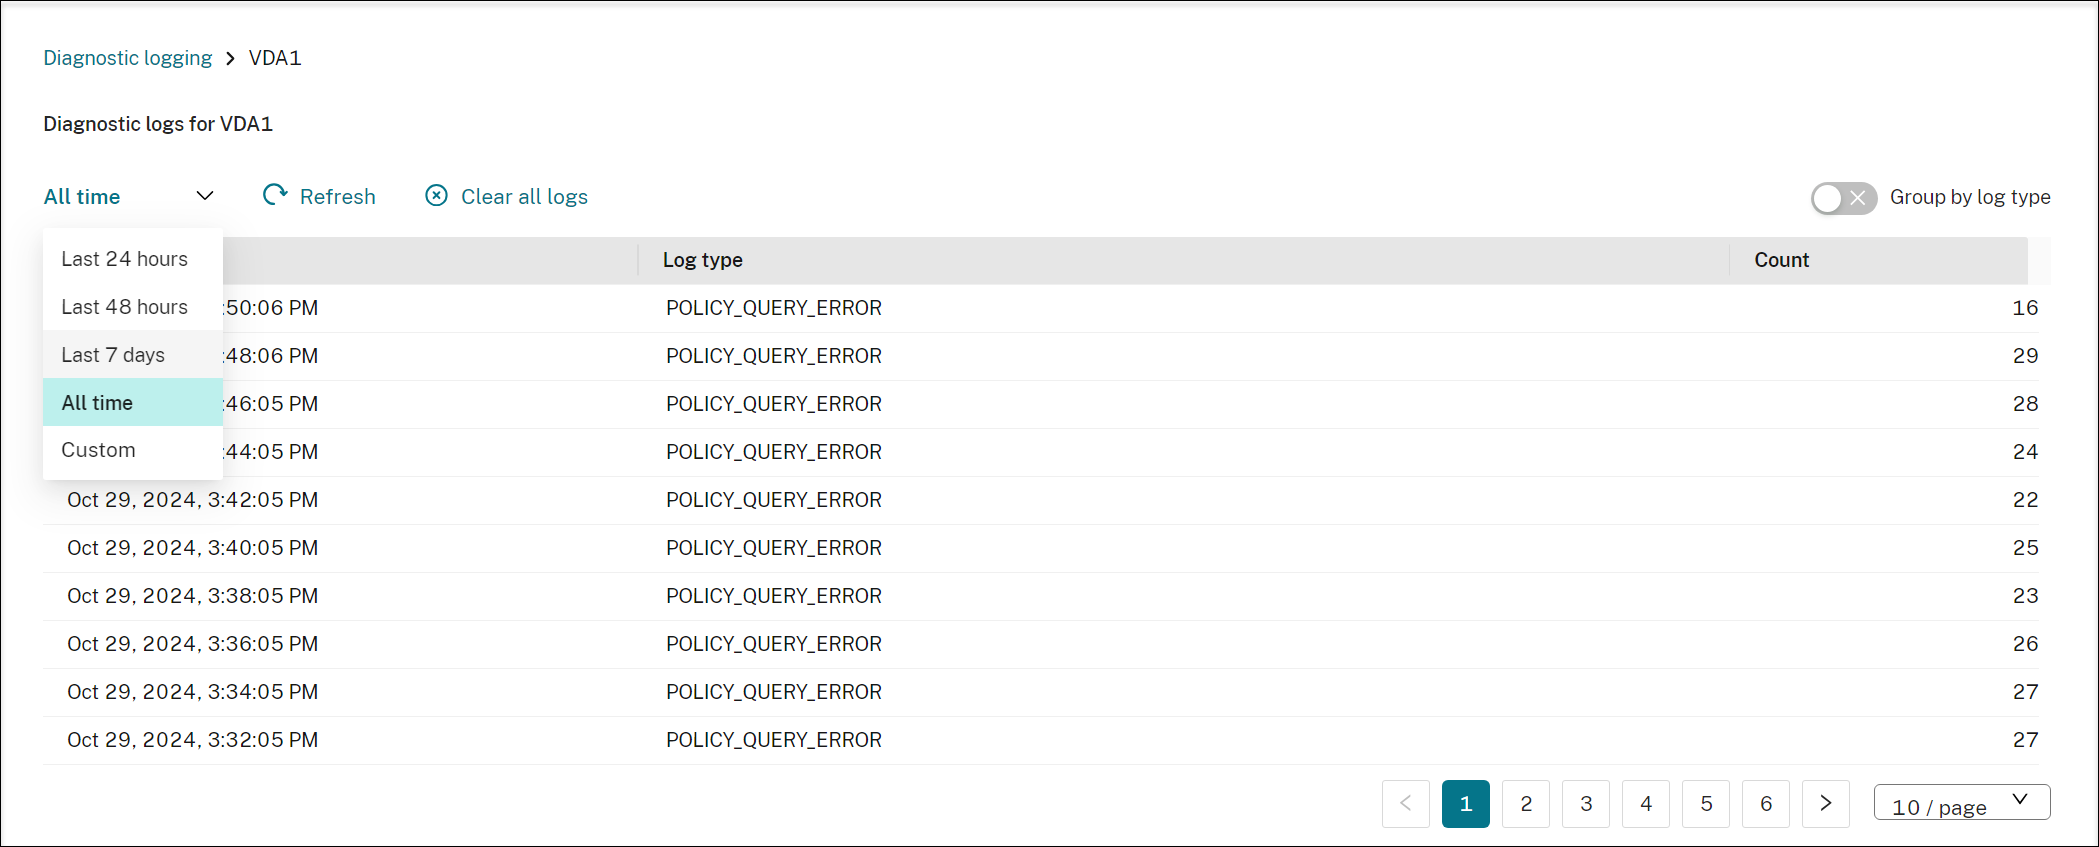
- To check for any incoming logs, click Clear all logs to hide the currently displayed logs, and then click Refresh.