Alerts and notifications
Monitor alerts
Alerts are displayed in Director on the dashboard and other high level views with warning and critical alert symbols. Alerts are available for Platinum licensed Sites. Alerts update automatically every minute; you can also update alerts on demand.
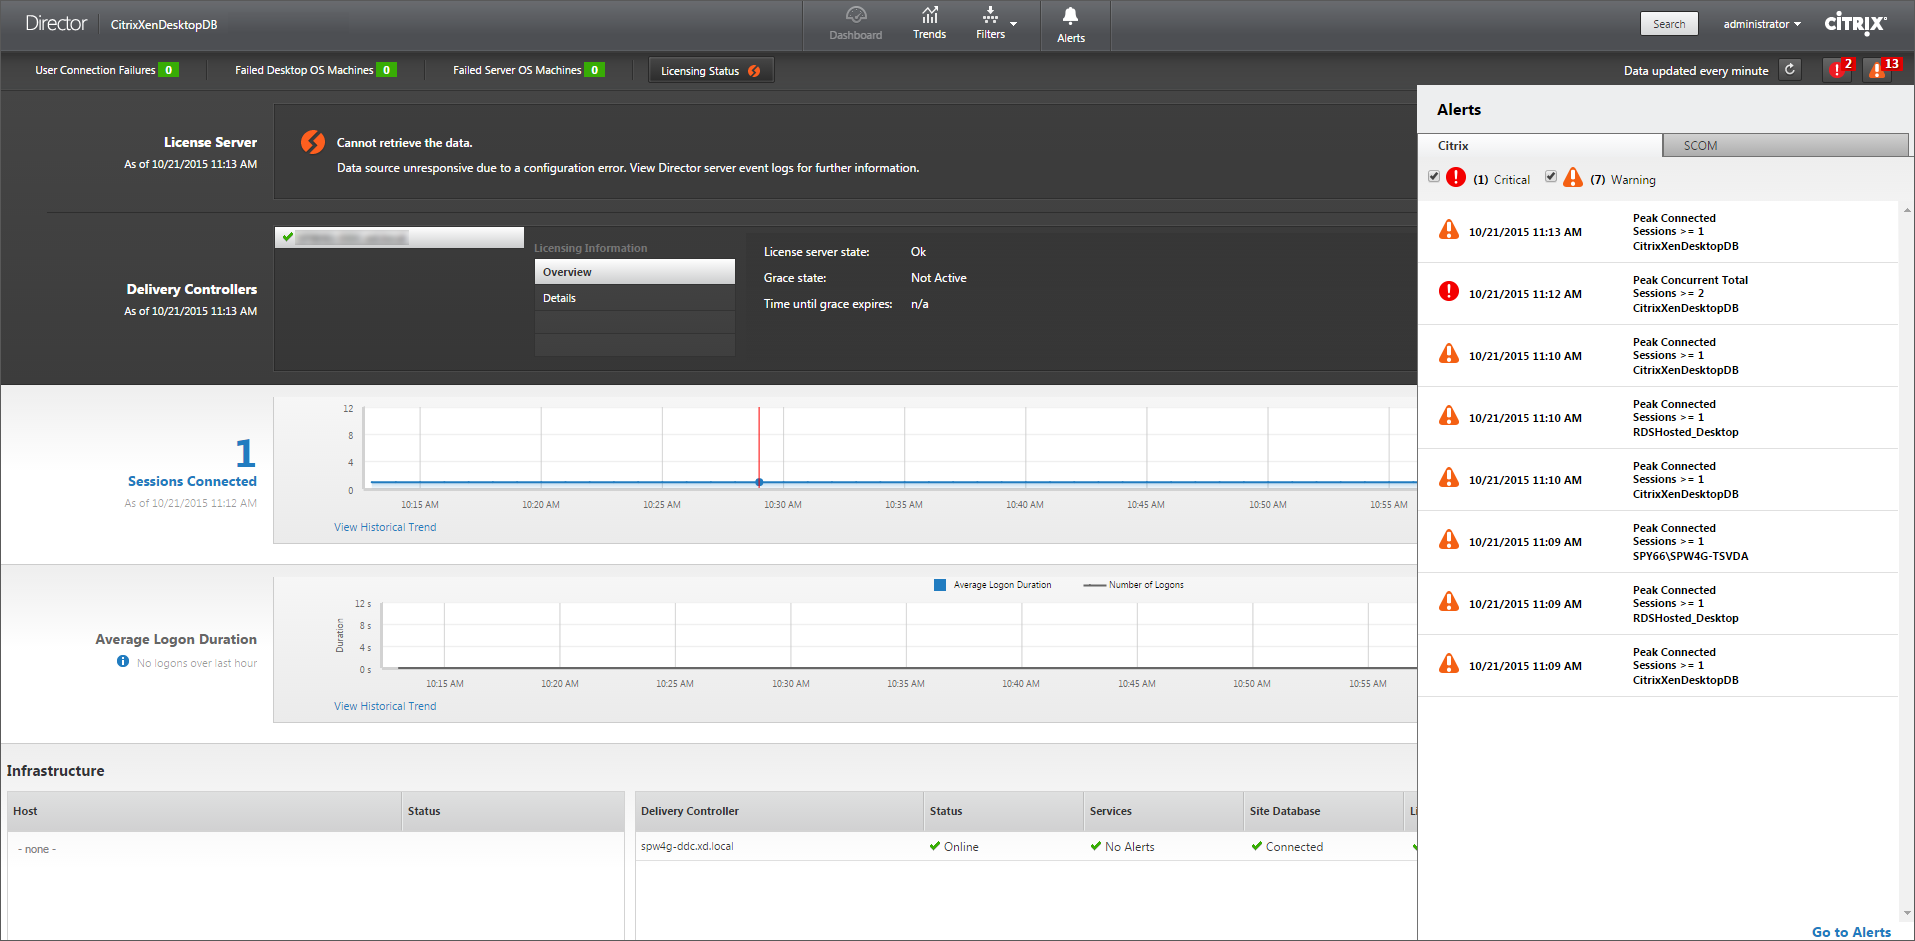
A warning alert (amber triangle) indicates that the warning threshold of a condition has been reached or exceeded.
A critical alert (red circle) shows that the critical threshold of a condition has been reached or exceeded.
You can view more detailed information on alerts by selecting an alert from the sidebar, clicking the Go to Alerts link at the bottom of the sidebar or by selecting Alerts from the top of the Director page.
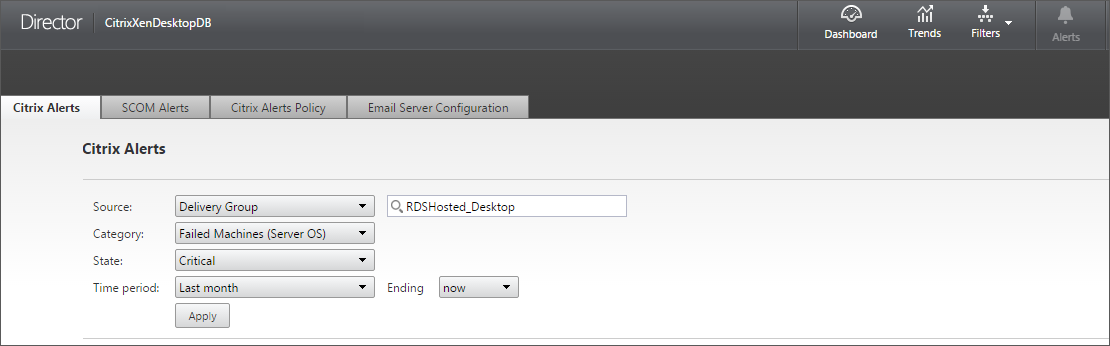
In the Alerts view, you can filter and export alerts. For example, Failed Server OS machines for a specific Delivery Group over the last month, or all alerts for a specific user. For more information, see Export reports.
Citrix alerts. Citrix alerts are alerts monitored in Director that originate from Citrix components. You can configure Citrix alerts within Director in Alerts > Citrix Alerts Policy. As part of the configuration, you can set notifications to be sent by email to individuals and groups when alerts exceed the thresholds you have set up. You can configure the notification as Octoblu webhooks, or SNMP traps also. For more information on setting up Citrix Alerts, see Create alerts policies.
SCOM alerts. SCOM alerts display alert information from Microsoft System Center 2012 Operations Manager (SCOM) to provide a more comprehensive indication of data center health and performance within Director. For more information, see SCOM alerts.
The number of alerts displayed next to the alerts icons before you expand the sidebar are the combined sum of Citrix® and SCOM alerts.
Create alerts policies
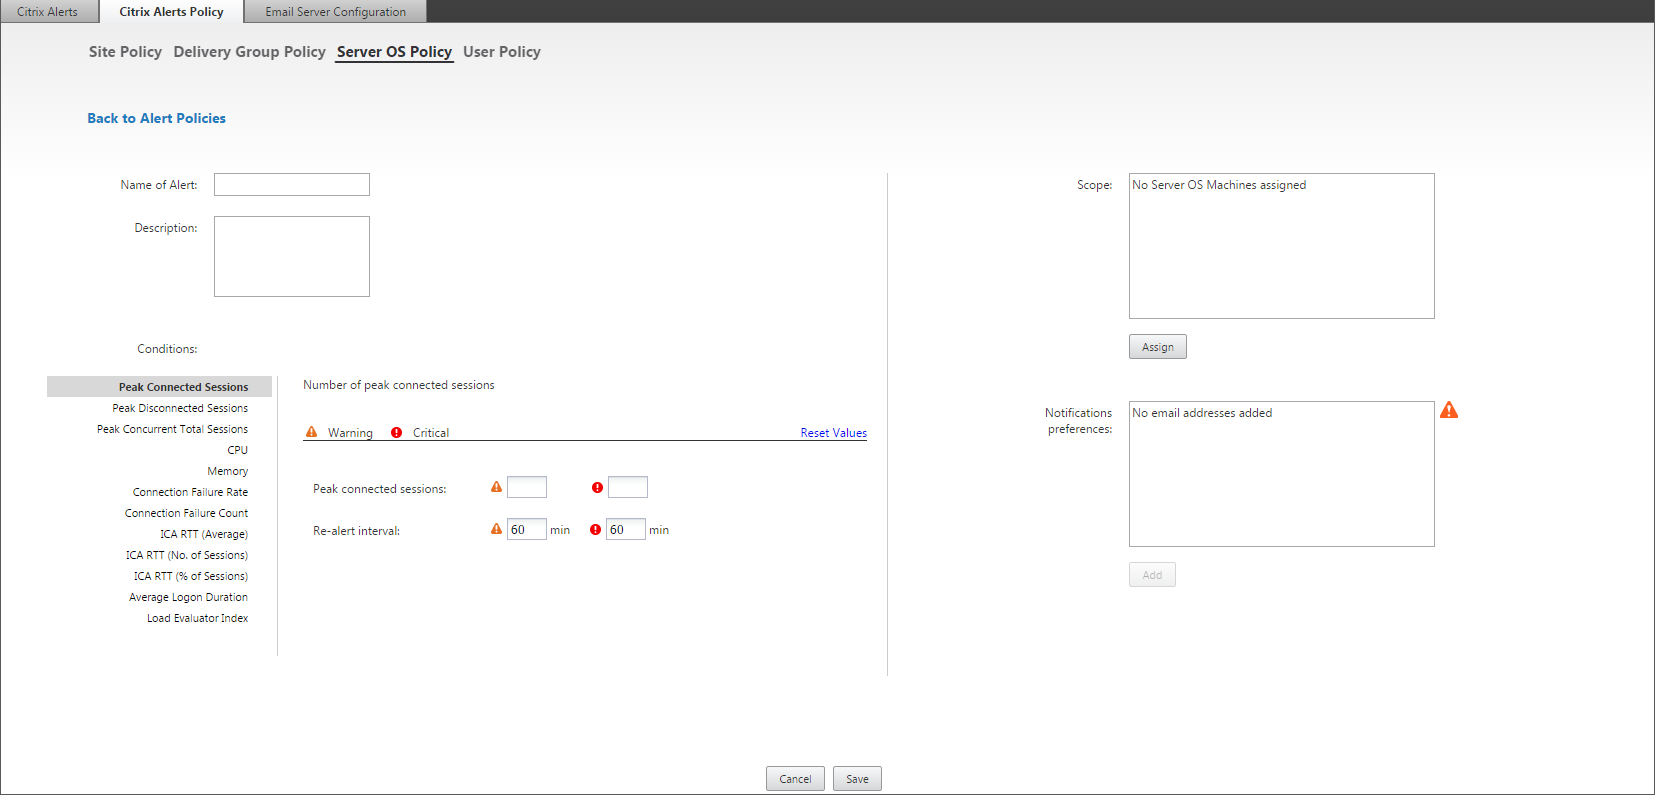
To create a new alerts policy, for example, to generate an alert when a specific set of session count criteria are met:
- Go to Alerts > Citrix Alerts Policy and select, for example, Server OS Policy.
- Click Create.
- Name and describe the policy, then set the conditions that have to be met for the alert to be triggered. For example, specify Warning and Critical counts for Peak Connected Sessions, Peak Disconnected Sessions, and Peak Concurrent Total Sessions. Warning values must not be greater than Critical values. For more information, see Alerts policies conditions.
- Set the Re-alert interval. If the conditions for the alert are still met, the alert is triggered again at this time interval and, if set up in the alert policy, an email notification is generated. A dismissed alert does not generate an email notification at the re-alert interval.
- Set the Scope. For example, set for a specific Delivery Group.
- In Notification preferences, specify who should be notified by email when the alert is triggered. You have to specify an email server on the Email Server Configuration tab in order to set email Notification preferences in Alerts Policies.
- Click Save.
For information about Octoblu webhook configuration, see Configure alerts policies with Octoblu webhooks.
For information about SNMP trap configuration, see Configure alerts policies with SNMP traps.
Creating a policy with 20 or more Delivery Groups defined in the Scope might take approximately 30 seconds to complete the configuration. A spinner is displayed during this time.
Creating more than 50 policies for up to 20 unique Delivery Groups (1000 Delivery Group targets in total) might result in an increase in response time (over 5 seconds).
Moving a machine containing active sessions from one Delivery Group to another might trigger erroneous Delivery Group alerts that are defined using machine parameters.
Alerts policies conditions
| Alert policy condition | Description and recommended actions |
|---|---|
| Peak Connected Sessions | Number of peak connected sessions. Check Director Session Trends view for peak connected sessions. Check to ensure there is enough capacity to accommodate the session load. Add new machines if needed. |
| Peak Disconnected Sessions | Number of peak disconnected sessions. Check Director Session Trends view for peak disconnected sessions. Check to ensure there is enough capacity to accommodate session load. Add new machines if needed. Log off disconnected sessions if needed. |
| Peak Concurrent Total Sessions | Number of peak concurrent sessions. Check Director Session Trends view in Director for peak concurrent sessions. Check to ensure there is enough capacity to accommodate session load. Add new machines if needed. Log off disconnected sessions if needed. |
| CPU | Percentage CPU usage. Identify the processes or resources consuming CPU. End the process if necessary. Ending the process will cause unsaved data to be lost. If all is working as expected, add additional CPU resources in the future. Note: The policy setting, Enable resource monitoring, is allowed by default for the monitoring of CPU and memory performance counters on machines with VDAs. If this policy setting is disabled, alerts with CPU and memory conditions will not be triggered. For more information, see Monitoring policy. |
| Memory | Percentage Memory usage. Identify the processes or resources consuming memory. End the process if necessary. Ending the process will cause unsaved data to be lost. If all is working as expected, add additional memory in the future. Note: The policy setting, Enable resource monitoring, is allowed by default for the monitoring of CPU and memory performance counters on machines with VDAs. If this policy setting is disabled, alerts with CPU and memory conditions will not be triggered. For more information, see Monitoring policy settings. |
| Connection Failure Rate | Percentage of connection failures over the last hour. Calculated based on the total failures to total connections attempted. Check Director Connection Failures Trends view for events logged from the Configuration log. Determine if applications or desktops are reachable. |
| Connection Failure Count | Number of connection failures over the last hour. Check Director Connection Failures Trends view for events logged from the Configuration log. Determine if applications or desktops are reachable. |
| ICA RTT (Average) | Average ICA round-trip time Check NetScaler HDX Insight for a breakdown of the ICA RTT to determine root cause. If NetScaler is not available, check the Director User Details view for the ICA RTT and Latency and determine if it is a network problem or XD/XA issue. For more information, see the NetScaler Insight Center documentation, Use Cases: HDX Insight. |
| ICA RTT (No. of Sessions) | Number of sessions which exceed the threshold ICA round-trip time. Check NetScaler HDX Insight for the number of sessions with high ICA RTT. For more information, see the NetScaler Insight Center documentation, HDX Insight Reports. If NetScaler is not available, work with the network team to determine root cause. |
| ICA RTT (% of Session) | Percentage of sessions which exceed the average ICA round-trip time. Check NetScaler HDX Insight for the number of sessions with high ICA RTT. For more information, see the NetScaler Insight Center documentation, HDX Insight Reports. If NetScaler is not available, work with the network team to determine root cause. |
| ICA® RTT (User) | ICA round-trip time which is applied to sessions launched by the specified user. The alert is triggered if ICA RTT is higher than the threshold in at least one session. |
| Failed Machines (Desktop OS) | Number of failed Desktop OS machines. Failures can occur for various reasons as shown in the Director dashboard and Filters views. Run Citrix Scout diagnostics to determine root cause. For more information, see Troubleshoot user issues. |
| Failed Machines (Server OS) | Number of failed Server OS machines. Failures can occur for various reasons as shown in the Director dashboard and Filters views. Run Citrix Scout diagnostics to determine root cause. |
| Average Logon Duration | Average logon duration for logons which occurred over the last hour. Check the Director dashboard to get up to date metrics regarding the logon duration. A large number of users logging in during a short timeframe can cause elongated logons. Check the baseline and break down of the logons to narrow down the cause. For more information, see Diagnose user logon issues. |
| Logon Duration (User) | Logon duration for logons for the specified user which occurred over the last hour. |
| Load Evaluator Index | Value of the Load Evaluator Index over the last 5 minutes. Check Director for Server OS Machines that may have a peak load (Max load).View both dashboard (failures) and Trends Load Evaluator Index report. |
Configure alerts policies with Octoblu webhooks
Apart from email notifications, you can configure alerts policies with Octoblu webhooks to initiate IoT services.
Note: This feature requires Delivery Controller(s) version 7.11 or later.
Examples of IoT services that can utilize alerts include sending SMS notifications to support staff or integrating with custom incident resolution platforms to help in tracking notifications.
You can configure an alert policy with an HTTP callback or an HTTP POST using PowerShell cmdlets. They are extended to support webhooks.
For information on the creation of a new Octoblu workflow and obtaining the corresponding webhook URL, see the Octoblu Developer Hub.
To configure an Octoblu webhook URL for a new alert policy or an existing policy, use the following PowerShell cmdlets.
Create a new alerts policy with a webhook URL:
$policy = New-MonitorNotificationPolicy -Name <Policy name> -Description <Policy description> -Enabled $true -Webhook <Webhook URL>
Add a webhook URL to an existing alerts policy:
Set-MonitorNotificationPolicy - Uid <Policy id> -Webhook <Webhook URL>
For help on the PowerShell commands, use the PowerShell help, for example:
Get-Help <Set-MonitorNotificationPolicy>
Notifications generated from the alert policy trigger the webhook with a POST call to the webhook URL. The POST message contains the notification information in JSON format:
{"NotificationId" : \<Notification Id\>,

"Target" : \<Notification Target Id\>,

"Condition" : \<Condition that was violated\>,

"Value" : \<Threshold value for the Condition\>,

"Timestamp": \<Time in UTC when notification was generated\>,

"PolicyName": \<Name of the Alert policy\>,

"Description": \<Description of the Alert policy\>,

"Scope" : \<Scope of the Alert policy\>,

"NotificationState": \<Notification state critical, warning, healthy or dismissed\>,

"Site" : \<Site name\>}
<!--NeedCopy-->
Configure alerts policies with SNMP traps
When an alert configured with an SNMP trap triggers, the corresponding SNMP trap message is forwarded to the configured network listener for further processing. Citrix alerts support traps of SNMP version 2 and later. Currently, the trap message can be forwarded to one listener.
Note: This feature requires Delivery Controller(s) version 7.12 or later.
To configure SNMP traps, use the following PowerShell cmdlets:
-
Get the current SNMP server configuration:
Get-MonitorNotificationSnmpServerConfiguration -
Set server configuration for SNMP version 2:
Set-MonitorNotificationSnmpServerConfiguration -ServerName <Server IP> -PortNumber <Port ID> -SnmpSender <Sender name> -CommunityString public -Protocol V2 -
Set server configuration for SNMP version 3:
$authpass = "<authentication password>" | ConvertTo-SecureString -AsPlainText -Force $privpass = "<Privacy password>" | ConvertTo-SecureString -AsPlainText -Force Set-MonitorNotificationSnmpServerConfiguration -ServerName <Server IP> -PortNumber <Port ID> -SnmpSender <Sender name> -EngineId <Engine Id> -AuthPassword $authpass -PrivPassword $privpass -PrivPasswordProtocol <Privacy password protocol> -AuthPasswordProtocol <Authentication password protocol> -Protocol V3 <!--NeedCopy--> -
Enable SNMP trap for an existing alert policy:
Set-MonitorNotificationPolicy -IsSnmpEnabled $true -Uid <Policy ID> -
Create a new alert policy with SNMP trap configuration:
$policy = New-MonitorNotificationPolicy -Name <Policy name> -IsSnmpEnabled $true -Description <Policy description> -Enabled $true
The structure of the OIDs in the SNMP trap messages from Director is as follows: 1.3.6.1.4.1.3845.100.1.<UID> Here, <UID> is generated serially for every alert policy defined in Director. The OIDs are hence unique to each user environment.
- Use 1.3.6.1.4.1.3845.100.1 to filter all trap messages from Director.
- Use 1.3.6.1.4.1.3845.100.1.<UID> to filter and handle traps messages for specific alerts.
Use the following cmdlet to get the UIDs for the alert policies defined in your environment:
Get-MonitorNotificationPolicy
You can forward the SNMP traps to SCOM. To do this, configure SCOM with the Delivery Controller™ to listen to the trap messages.
Configure SCOM alerts integration
SCOM integration with Director lets you view alert information from SCOM on the Dashboard and in other high-level views in Director.
SCOM alerts are displayed on-screen alongside Citrix alerts. You can access and drill down into SCOM alerts from SCOM tab in the side bar.
You can view historical alerts up to one month old, sort, filter, and export the filtered information to CSV, Excel, and PDF report formats. For more information, see Export reports.
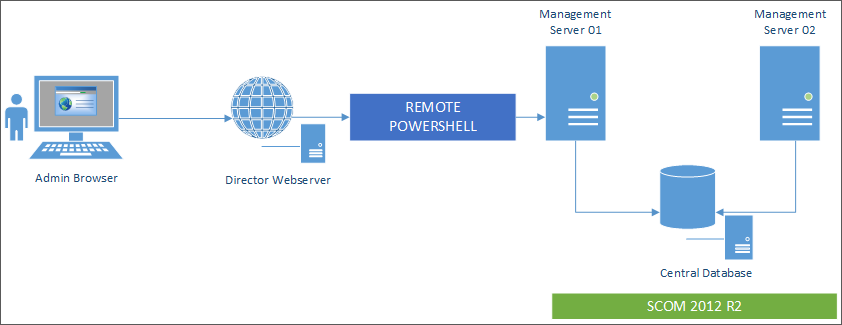
SCOM integration uses remote PowerShell 3.0 or later to query data from the SCOM Management Server and it maintains a persistent runspace connection in the user’s Director session. Director and SCOM server must have the same PowerShell version.
The requirements for SCOM integration are:
- Windows Server 2012 R2
- System Center 2012 R2 Operations Manager
- PowerShell 3.0 or later (PowerShell version on Director and the SCOM server must match)
- Quad Core CPU with 16 GB RAM (recommended)
- A primary Management Server for SCOM must be configured in the Director web.config file. You can do this using the DirectorConfig tool.
Note:
- Citrix recommends that the Director administrator account is configured as a SCOM Operator role so that can full alert information can be retrieved in Director. If this is not possible, a SCOM administrator account can be configured in the web.config file using the DirectorConfig tool.
- Citrix recommends that you do not configure more than 10 Director administrators per SCOM Management Server to ensure optimal performance.
On the Director server:
-
Type Enable-PSRemoting to enable PowerShell remoting.
-
Add the SCOM Management Server to the TrustedHosts list. Open a PowerShell prompt and execute the following command(s):
- Get the current list of TrustedHosts
        Get-Item WSMAN:\localhost\Client\TrustedHosts
<!--NeedCopy-->
1. Add the FQDN of the SCOM Management Server to the list of TrustedHosts. \<Old Values\> represents the existing set of entries returned from Get-Item cmdlet
       Set-Item WSMAN:\localhost\Client\TrustedHosts -Value "<FQDN SCOM Management Server>,<Old Values>"
<!--NeedCopy-->
- Configure SCOM using the DirectorConfig tool.
    C:\inetpub\wwwroot\Director\tools\DirectorConfig.exe /configscom
<!--NeedCopy-->
On the SCOM Management server:
-
Assign Director administrators to a SCOM administrator role.
-
Open the SCOM Management console and go to Administration > Security > User Roles.
-
In User Roles, you can create a new User Role or modify an existing one. There are four categories of SCOM operator roles that define the nature of access to SCOM data. For example, a Read-Only role does not see the Administration pane and cannot discover or manage rules, machines or accounts. An Operator role is a full administrator role.
Note: The following operations are not available if the Director administrator is assigned to a non-operator role:
-
If there are multiple management servers configured and the primary management server is not available, the Director administrator cannot connect to the secondary management server. The primary management server is the server configured in the Director web.config file, that is the same server as the one specified with the DirectorConfig tool in step 3 above. The secondary management servers are peer management servers of the primary server.
-
While filtering alerts, the Director administrator cannot search for the alert source. This requires an operator level permission.
-
-
To modify any User Role, right-click on the role, then click Properties.
-
In the User Role Properties dialog, you can add or remove Director administrators from the specified user role.
-
-
Add Director administrators to the Remote Management Users group on the SCOM Management server. This allows the Director administrators to establish a remote PowerShell connection.
-
Type Enable-PSRemoting to enable PowerShell remoting.
-
Set the WS-Management properties limits:
-
Modify MaxConcurrentUsers:
In CLI:
winrm set winrm/config/winrs @{MaxConcurrentUsers = "20"}In PS:
Set-Item WSMan:\localhost\Shell\MaxConcurrentUsers 20 -
Modify MaxShellsPerUser:
In CLI:
winrm set winrm/config/winrs @{MaxShellsPerUser="20"}In PS:
Set-Item WSMan:\localhost\Shell\MaxShellsPerUser 20 -
Modify MaxMemoryPerShellMB:
In CLI:
winrm set winrm/config/winrs @{MaxMemoryPerShellMB="1024"}In PS:
Set-Item WSMan:\localhost\Shell\MaxMemoryPerShellMB 1024
-
-
To ensure that SCOM integration works in mixed domain environments, set the following registry entry.
Path: HKEY_LOCAL_MACHINE\SOFTWARE\Microsoft\Windows\CurrentVersion\Policies\System
Key: LocalAccountTokenFilterPolicy
Type: DWord
Value: 1
Caution: Editing the registry incorrectly can cause serious problems that might require you to reinstall your operating system. Citrix cannot guarantee that problems resulting from the incorrect use of Registry Editor can be solved. Use Registry Editor at your own risk. Be sure to back up the registry before you edit it.
Once SCOM integration is set up you might see the message “Cannot get the latest SCOM alerts. View the Director server event logs for more information”. The server event logs help identify and correct the problem. Causes can include:
- Loss of network connectivity at the Director or SCOM machine.
- The SCOM service is not available or too busy to respond.
- Failed authorization due to a change in permissions for the configured user.
- An error in Director while processing the SCOM data.
- PowerShell version mismatch between Director and SCOM server.