This content has been machine translated dynamically.
Dieser Inhalt ist eine maschinelle Übersetzung, die dynamisch erstellt wurde. (Haftungsausschluss)
Cet article a été traduit automatiquement de manière dynamique. (Clause de non responsabilité)
Este artículo lo ha traducido una máquina de forma dinámica. (Aviso legal)
此内容已经过机器动态翻译。 放弃
このコンテンツは動的に機械翻訳されています。免責事項
이 콘텐츠는 동적으로 기계 번역되었습니다. 책임 부인
Este texto foi traduzido automaticamente. (Aviso legal)
Questo contenuto è stato tradotto dinamicamente con traduzione automatica.(Esclusione di responsabilità))
This article has been machine translated.
Dieser Artikel wurde maschinell übersetzt. (Haftungsausschluss)
Ce article a été traduit automatiquement. (Clause de non responsabilité)
Este artículo ha sido traducido automáticamente. (Aviso legal)
この記事は機械翻訳されています.免責事項
이 기사는 기계 번역되었습니다.책임 부인
Este artigo foi traduzido automaticamente.(Aviso legal)
这篇文章已经过机器翻译.放弃
Questo articolo è stato tradotto automaticamente.(Esclusione di responsabilità))
Translation failed!
Reports
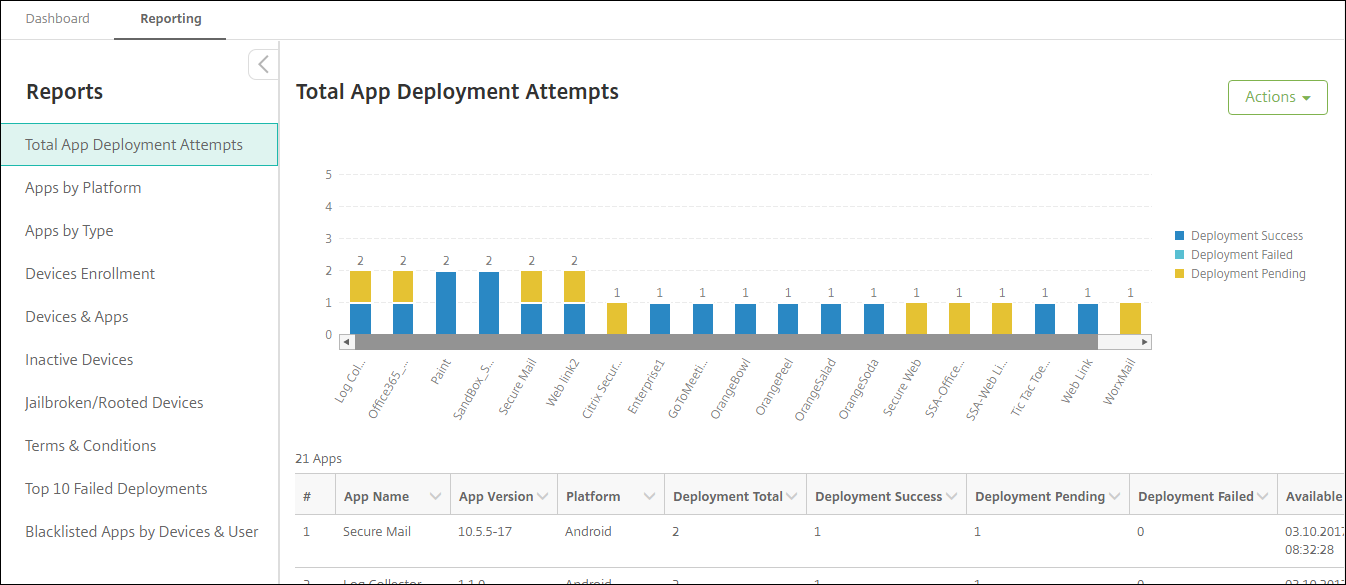
XenMobile® provides the following pre-defined reports that let you analyze your app and device deployments. Each report appears as a table and a chart. You can sort and filter the tables by column. You can select elements in the chart for more detailed information.
- Total Apps Deployment Attempts: Lists deployed apps that users tried to install on their devices.
- Apps by Platform: Lists apps and app versions by device platform and version.
- Apps by Type: Lists apps by version, type, and category.
- Device Enrollment: Lists all enrolled devices.
- Devices & Apps: Lists devices that are running managed apps.
- Inactive Devices: A list of devices that have not had any activity for the number of days specified by the XenMobile Server property device.inactivity.days.threshold.
- Jailbroken/Rooted Devices: Lists jailbroken iOS devices and rooted Android devices.
- Terms & Conditions: Lists users who have accepted and declined Terms and Conditions agreements. You can select areas of the chart to view more details.
- Top 10 Apps: Failed Deployment - Lists up to 10 apps that have failed to deploy.
-
Blacklisted Apps by Device & User: Lists blocked apps that users have on their devices.
Note:
The XenMobile Server console includes the terms “blacklist” and “whitelist”. We are changing those terms in an upcoming release to “block list” and “allow list”.
- Non-Compliant Devices: Lists devices that don’t meet compliance criteria such as whether the device is jailbroken, the OS version running, and if the device has a passcode.
You can export the data in each table in .csv format, which you can open by using programs like Microsoft Excel. You can export the chart for each report in PDF format.
- Top 100 Installed Apps: Lists up to top 100 apps installed for each platform. For more information, see Server properties
To generate a report
- In the XenMobile console, click Analyze > Reporting. The Reporting page appears.
-
Click the report that you want to generate.
To view more details of a report
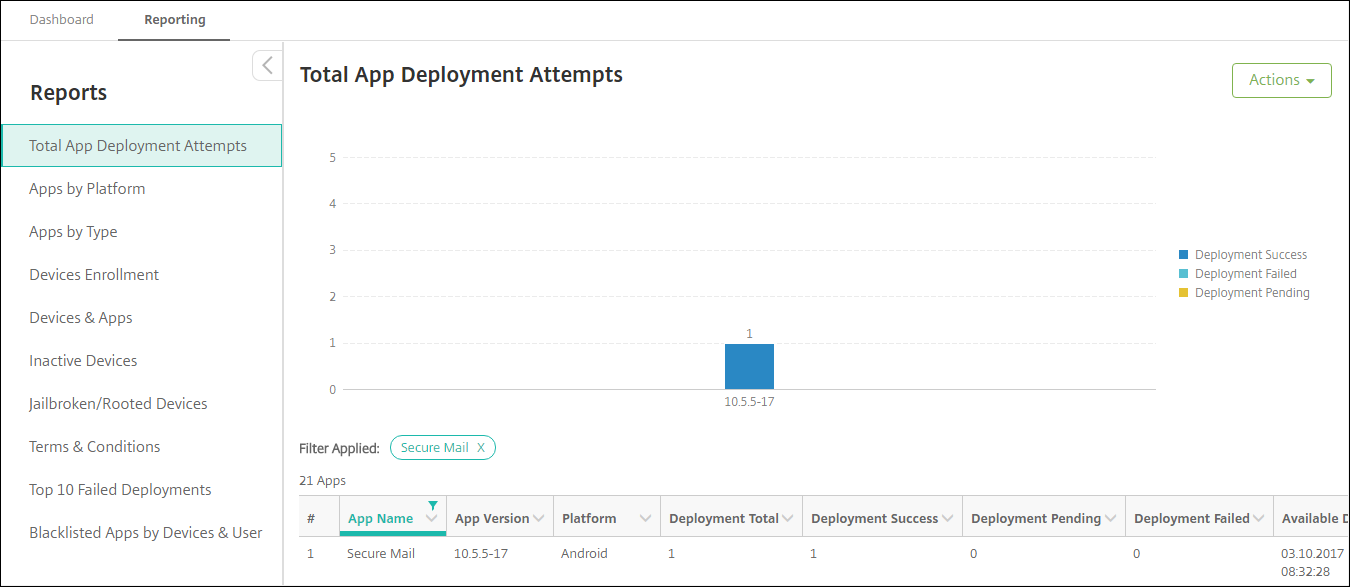
-
Click the areas of the chart to drill down and see more detailed information.
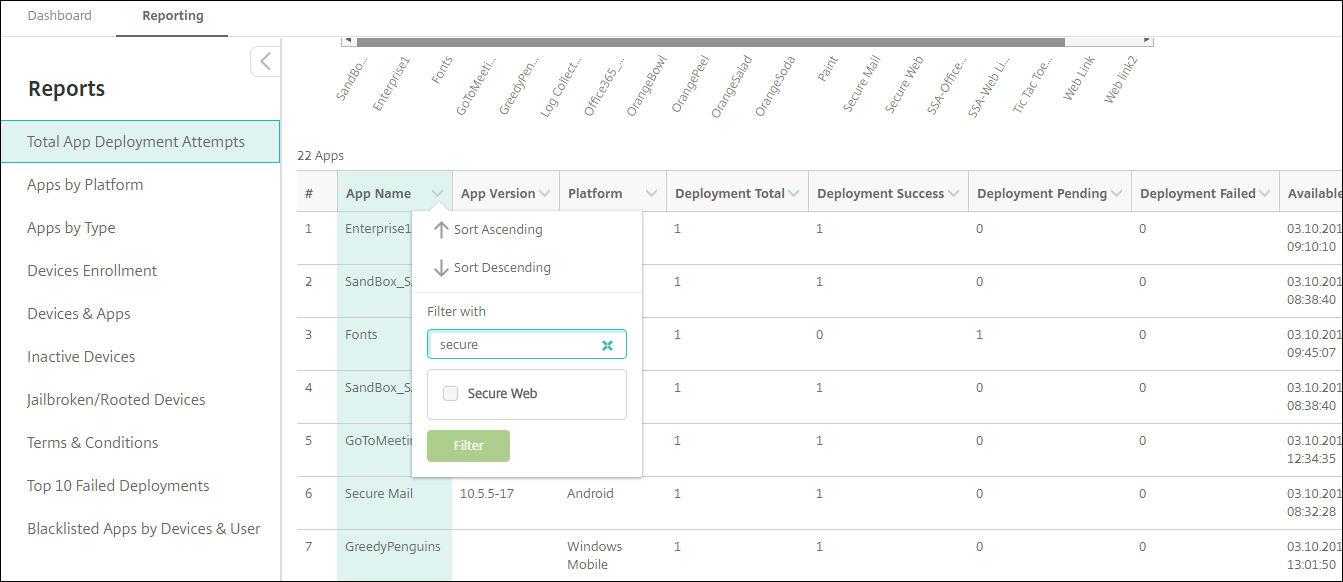
To sort, filter, or search a table column, click the column heading
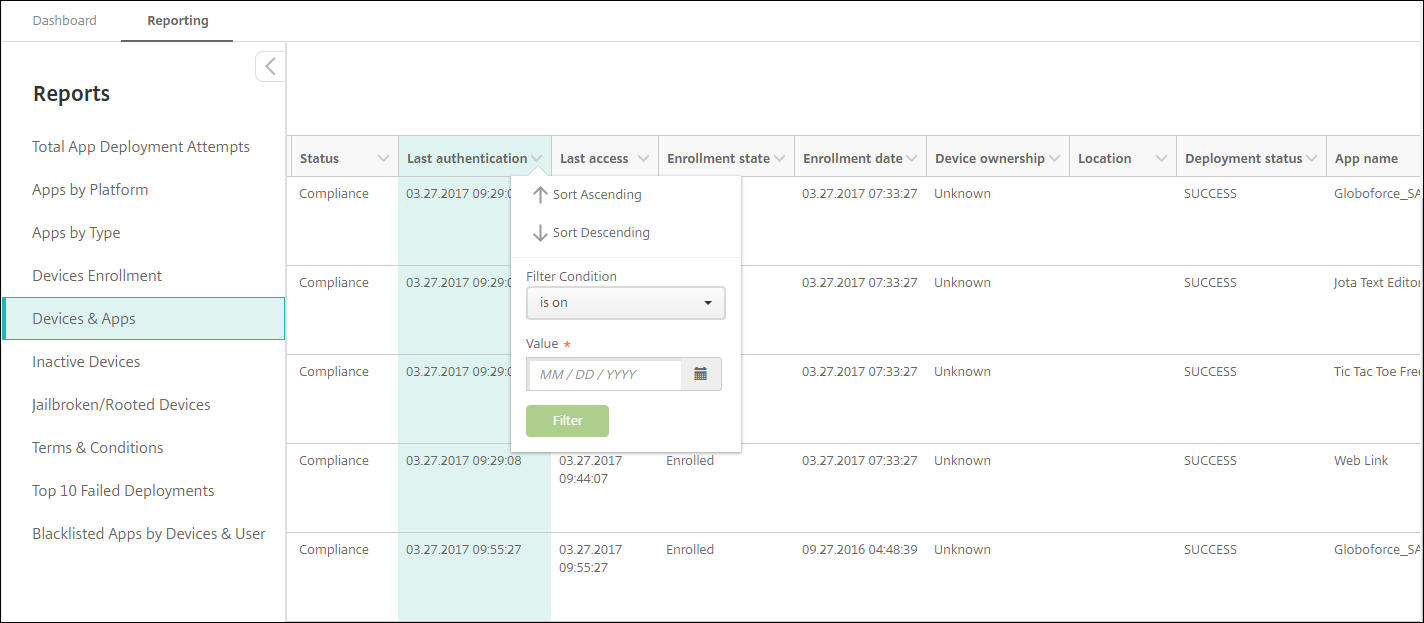
To filter the report by date
-
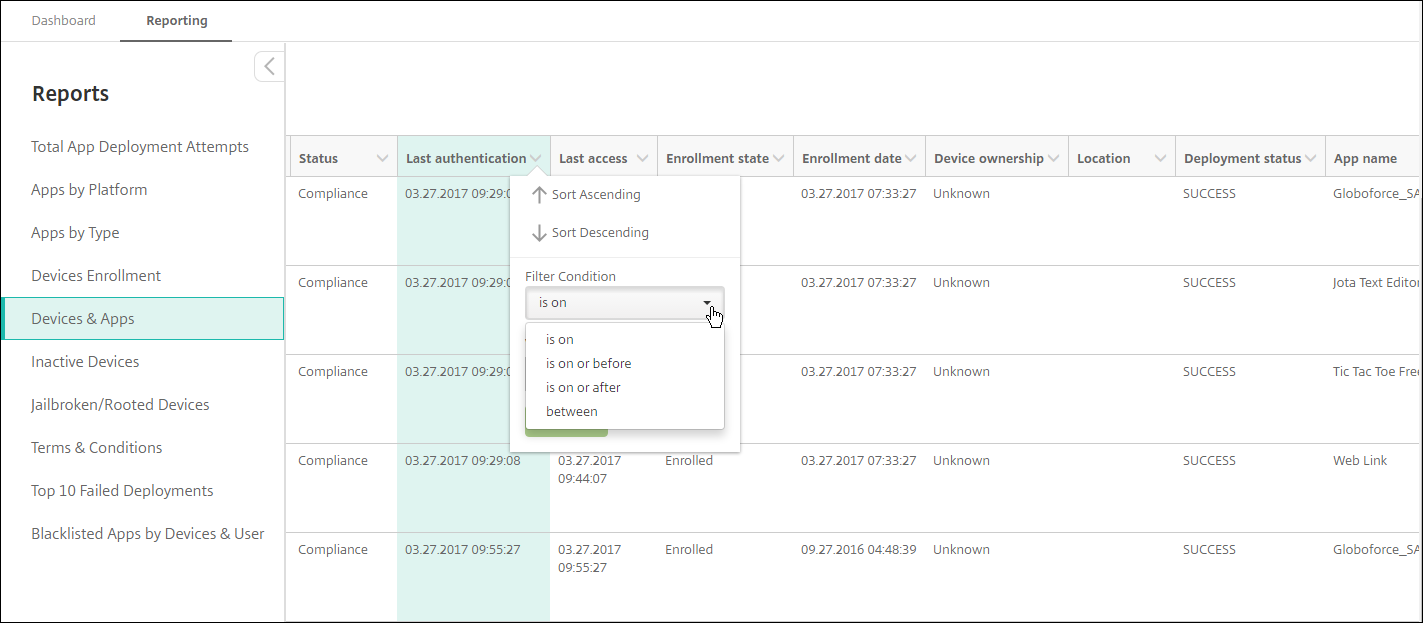
Click a column heading to view the filter settings.
-
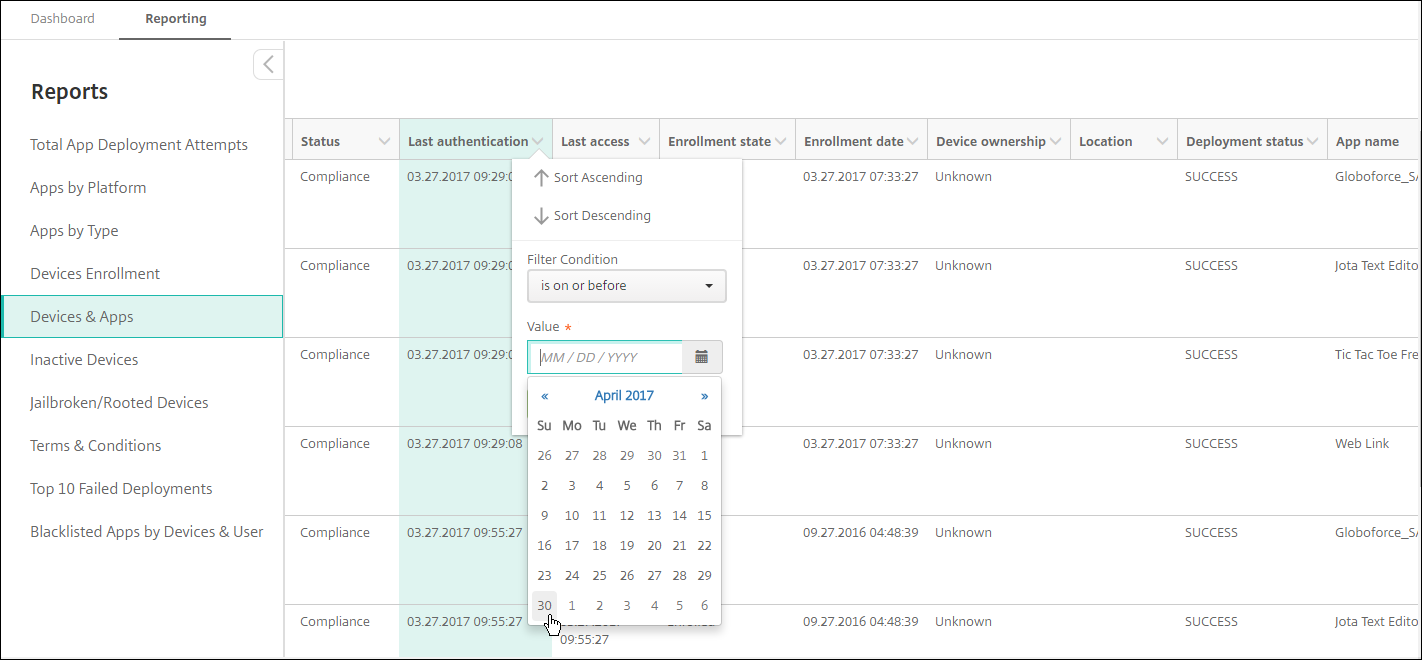
From Filter Condition, choose how you want to restrict the dates reported.
-
Use the date chooser to specify dates.
-
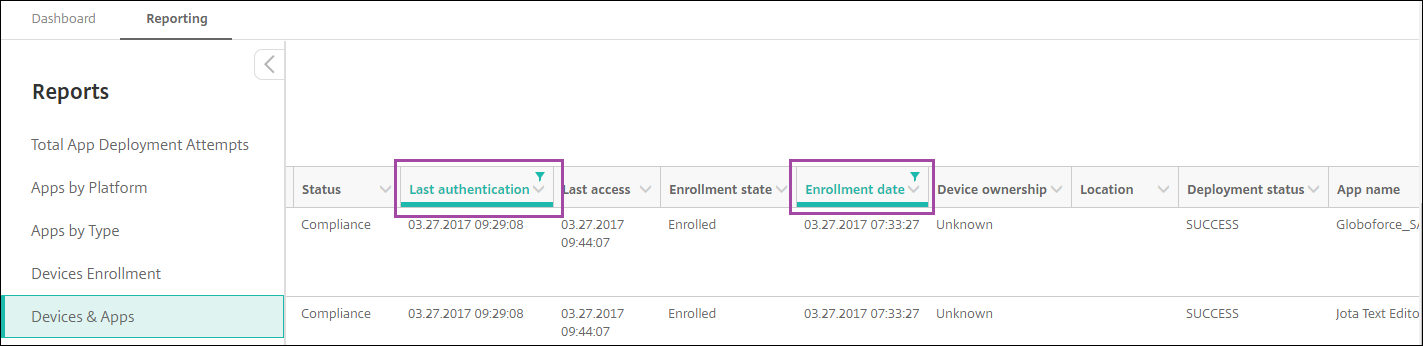
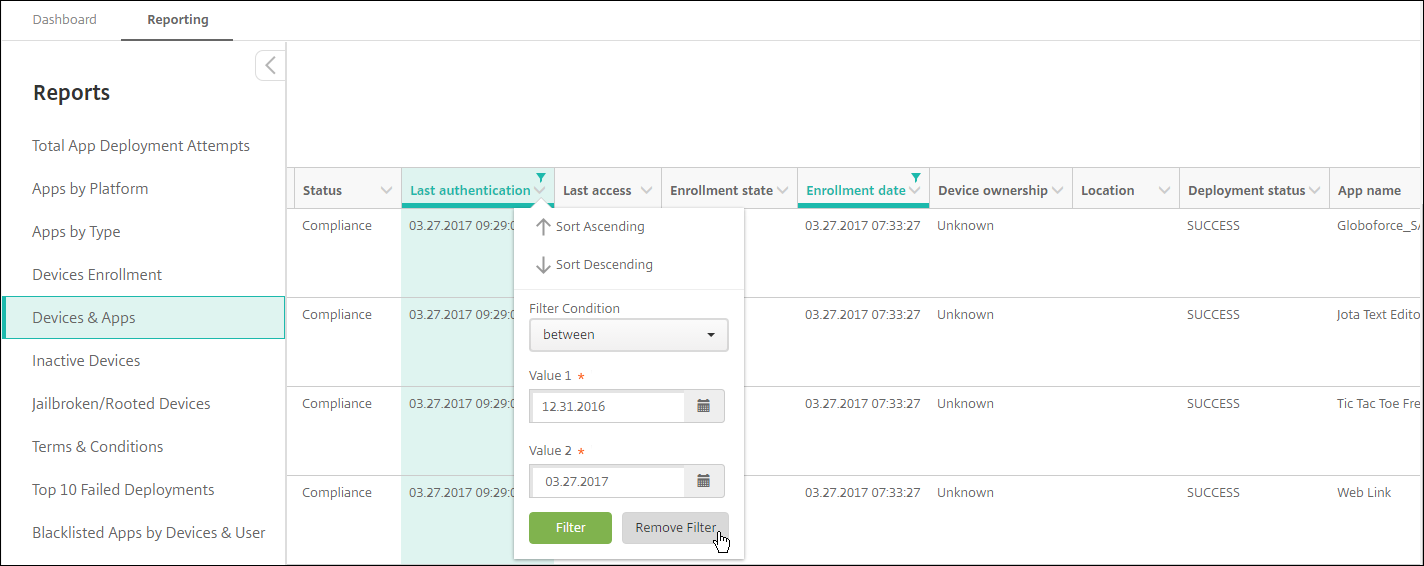
A column with a date filter displays as shown the following example.
-
To remove a filter, click the column heading and then click Remove Filter
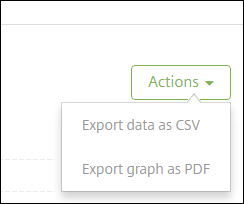
To export a chart or table
- To export the chart in PDF format, click Actions then Export graph as PDF.
- To export the table data in CSV format, click Actions then Export data as CVS.
Important:
Although it is possible to use SQL Server to create custom reports, Citrix® doesn’t recommend this method. Citrix doesn’t publish the schema and can change the schema without notification. If you do decide to pursue this method of reporting, make sure that SQL queries are run using a read-only account. A query with multiple JOINs that takes some time to run impacts XenMobile Server performance during that time.
Share
Share
This Preview product documentation is Citrix Confidential.
You agree to hold this documentation confidential pursuant to the terms of your Citrix Beta/Tech Preview Agreement.
The development, release and timing of any features or functionality described in the Preview documentation remains at our sole discretion and are subject to change without notice or consultation.
The documentation is for informational purposes only and is not a commitment, promise or legal obligation to deliver any material, code or functionality and should not be relied upon in making Citrix product purchase decisions.
If you do not agree, select I DO NOT AGREE to exit.