Cost modeling for Azure workloads
The new cost modeling feature supports Azure workloads and provides recommendations based on usage patterns. Customers receive recommendations on whether Azure Reservations or Savings Plan is more suitable to provide maximum cost savings. Azure Reservations customers reserve a specific number of machines upfront at a discounted flat cost, while savings plans allow them to commit to a dollar amount for discounted rates. The feature analyzes the last 28 days of data to provide estimated recommendations. This helps customers save costs by making informed decisions on resource allocation.
Note:
For optimal estimates, it is recommended to use data from a stable environment over the last 28 days. Avoid using data from periods of unusual activity, such as vacations or sudden spikes in usage. Wait until your usage returns to baseline levels before taking these recommendations.
Benefits:
- Provides tailored cost-saving recommendations.
- Supports both reservation and savings plans.
- Analyzes recent usage data for accurate insights.
- Helps optimize resource allocation and reduce expenses.
- Offers flexibility in selecting delivery groups, tags, VM series, and regions.
Note:
Cost modeling is supported only for Azure workloads.
Types of plans
In Azure, there are two types of plans to save costs:
- Azure Reservations: Customers decide how many machines to reserve upfront. Reservation has a different flat cost at a discounted rate compared to the pay-as-you-go cost.
- Savings Plan: Customers commit to a specific dollar amount rather than a number of machines. Up until that amount is consumed, they are charged a discounted cost. After that, they pay the pay-as-you-go cost.
The Cost modeling page provides recommendations for each plan independently, showing potential savings.
Click Cost optimization > Cost modeling. The Cost model and Cloud workloads page appears.
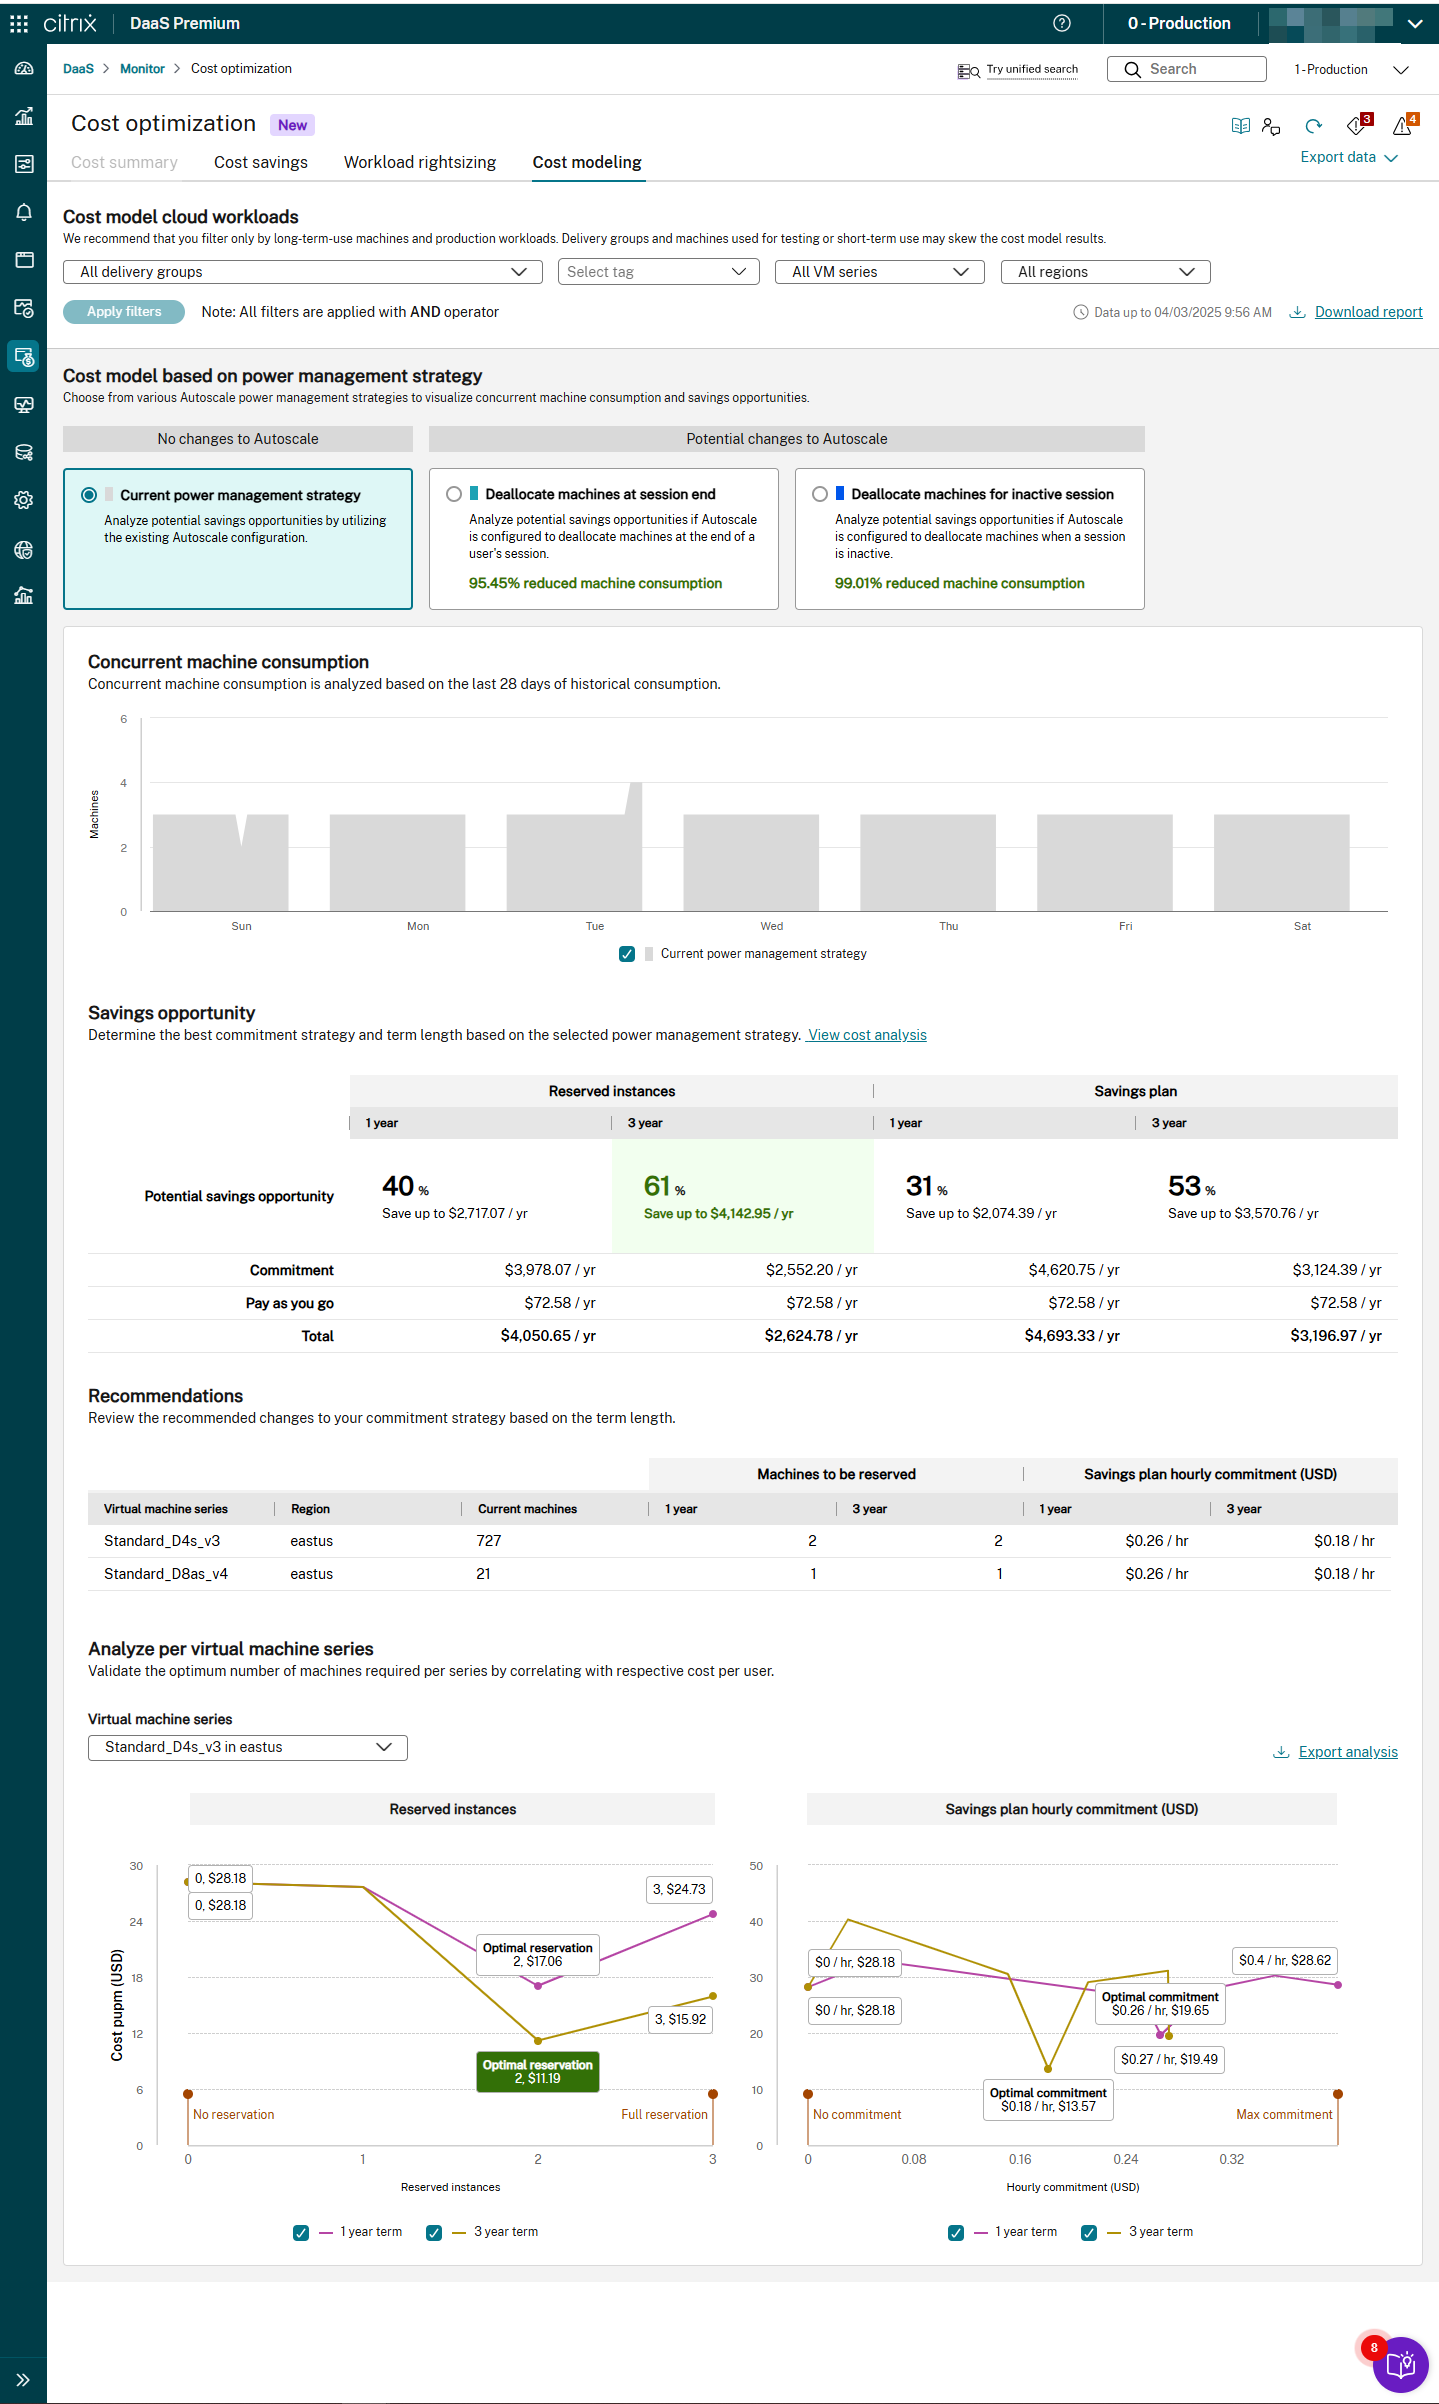
You can select all delivery groups, up to 15 (or the actual count) delivery groups, and exclude up to 15 (or the actual count) delivery groups if needed. You can select All single-session or All multi-session from drop-down lists. You can also filter by Tags, VM series, and Regions. If you do not select any options, the analysis runs on the entire applicable data set by default, considering the last 28 days of data.
Note:
The cost modeling recommendation is based on data from the last 28 days and assumes that the behavior during this period remains consistent.
Power management strategies
The data analysis varies based on the selected power management strategy. You can select one of the following Autoscale™ power management strategies to visualize the concurrent machine consumption and savings opportunities:
- Current power management strategy: Select this strategy to analyze potential savings using the existing Autoscale configuration. There is no change to the Autoscale configuration. The recommended cost modeling is generated based on the current Autoscale setup, calculating costs for all machines that are up and running.
- Deallocate machines at session end: Select this strategy if you are willing to change the Autoscale configuration to deallocate machines at the end of user sessions to analyze potential savings. The recommended cost modeling is generated based on the updated Autoscale configuration, calculating costs only for active session time, ignoring disconnect time.
- Deallocate machines for inactive session: Select this strategy if you are willing to change the Autoscale configuration to deallocate machines when sessions are inactive to analyze potential savings. The recommended cost modeling is generated based on the updated Autoscale configuration, calculating costs only for the time when sessions are active and not idle.
For example, if the machine is up for 60 minutes and the session is disconnected for 20 minutes, the remaining 40 minutes is the active session time. If the user is idle for 10 minutes during the active session, the net usage is only 30 minutes.
- In the Current power management strategy, the net usage is 60 minutes.
- In the Deallocate machines at session end strategy, the net usage, excluding disconnect time, is 40 minutes.
- In the Deallocate machines for inactive session strategy, including idle time, the net usage is 30 minutes.
These criteria serve as the baseline for analysis. These strategies help determine the net usage of machines more accurately.
Machine consumption and recommendations
The Cost modelingpage provides the following details on the machine consumption and recommendations:
-
Concurrent machine consumption graph: This graph displays the baseline usage over the last 28 days, with each bar representing one day of the week. The baseline is calculated using the 75th percentile (p75) of usage, an aggregation metric similar to average or median. For example, for each day and hour, such as Tuesday at 10 AM, the baseline is determined by analyzing the p75 of data from the previous four Tuesdays at 10 AM. This process is repeated for all hours and days of the week. Hover over the graph to view the number of machines consumed under the current power management strategy and the selected strategy when potential changes to Autoscale are applied.
-
Savings opportunity: View the potential savings opportunities for both Azure Reservations and Savings Plans for one-year and three-year terms. The savings opportunity for Commitment and Pay-as-you-go options is displayed.
-
Recommendations: View the recommended changes to both Azure Reservations and Savings Plans. The recommendations include commitments for each plan for all applicable combinations of virtual machine series, types, and regions. Data is available for one-year and three-year terms.
Analyze per virtual machine series
Select the virtual machine series from the drop-down list to validate the optimum number of machines with respect to cost per user. The cost per user per month is an estimate of the projected monthly cost per user. This estimate helps customers understand the projected monthly cost per user if they reserve a specific number of machines under Azure Reservations or commit to a specific hourly dollar amount under the Savings Plan. View the cost per user for Azure Reserved Instances and Savings Plan hourly commitments. The graph displays data points for various reservation levels (ranging from No Reservation to Full Reservation, including Optimal Reservation) and hourly cost commitment levels (ranging from No Commitment to Max Commitment, including Optimal Commitment).
The Cost modeling page provides valuable insights and recommendations to help customers optimize their Azure workloads and save costs. By analyzing usage patterns and selecting the appropriate plan, customers can achieve significant savings.