Management dashboard
Overview
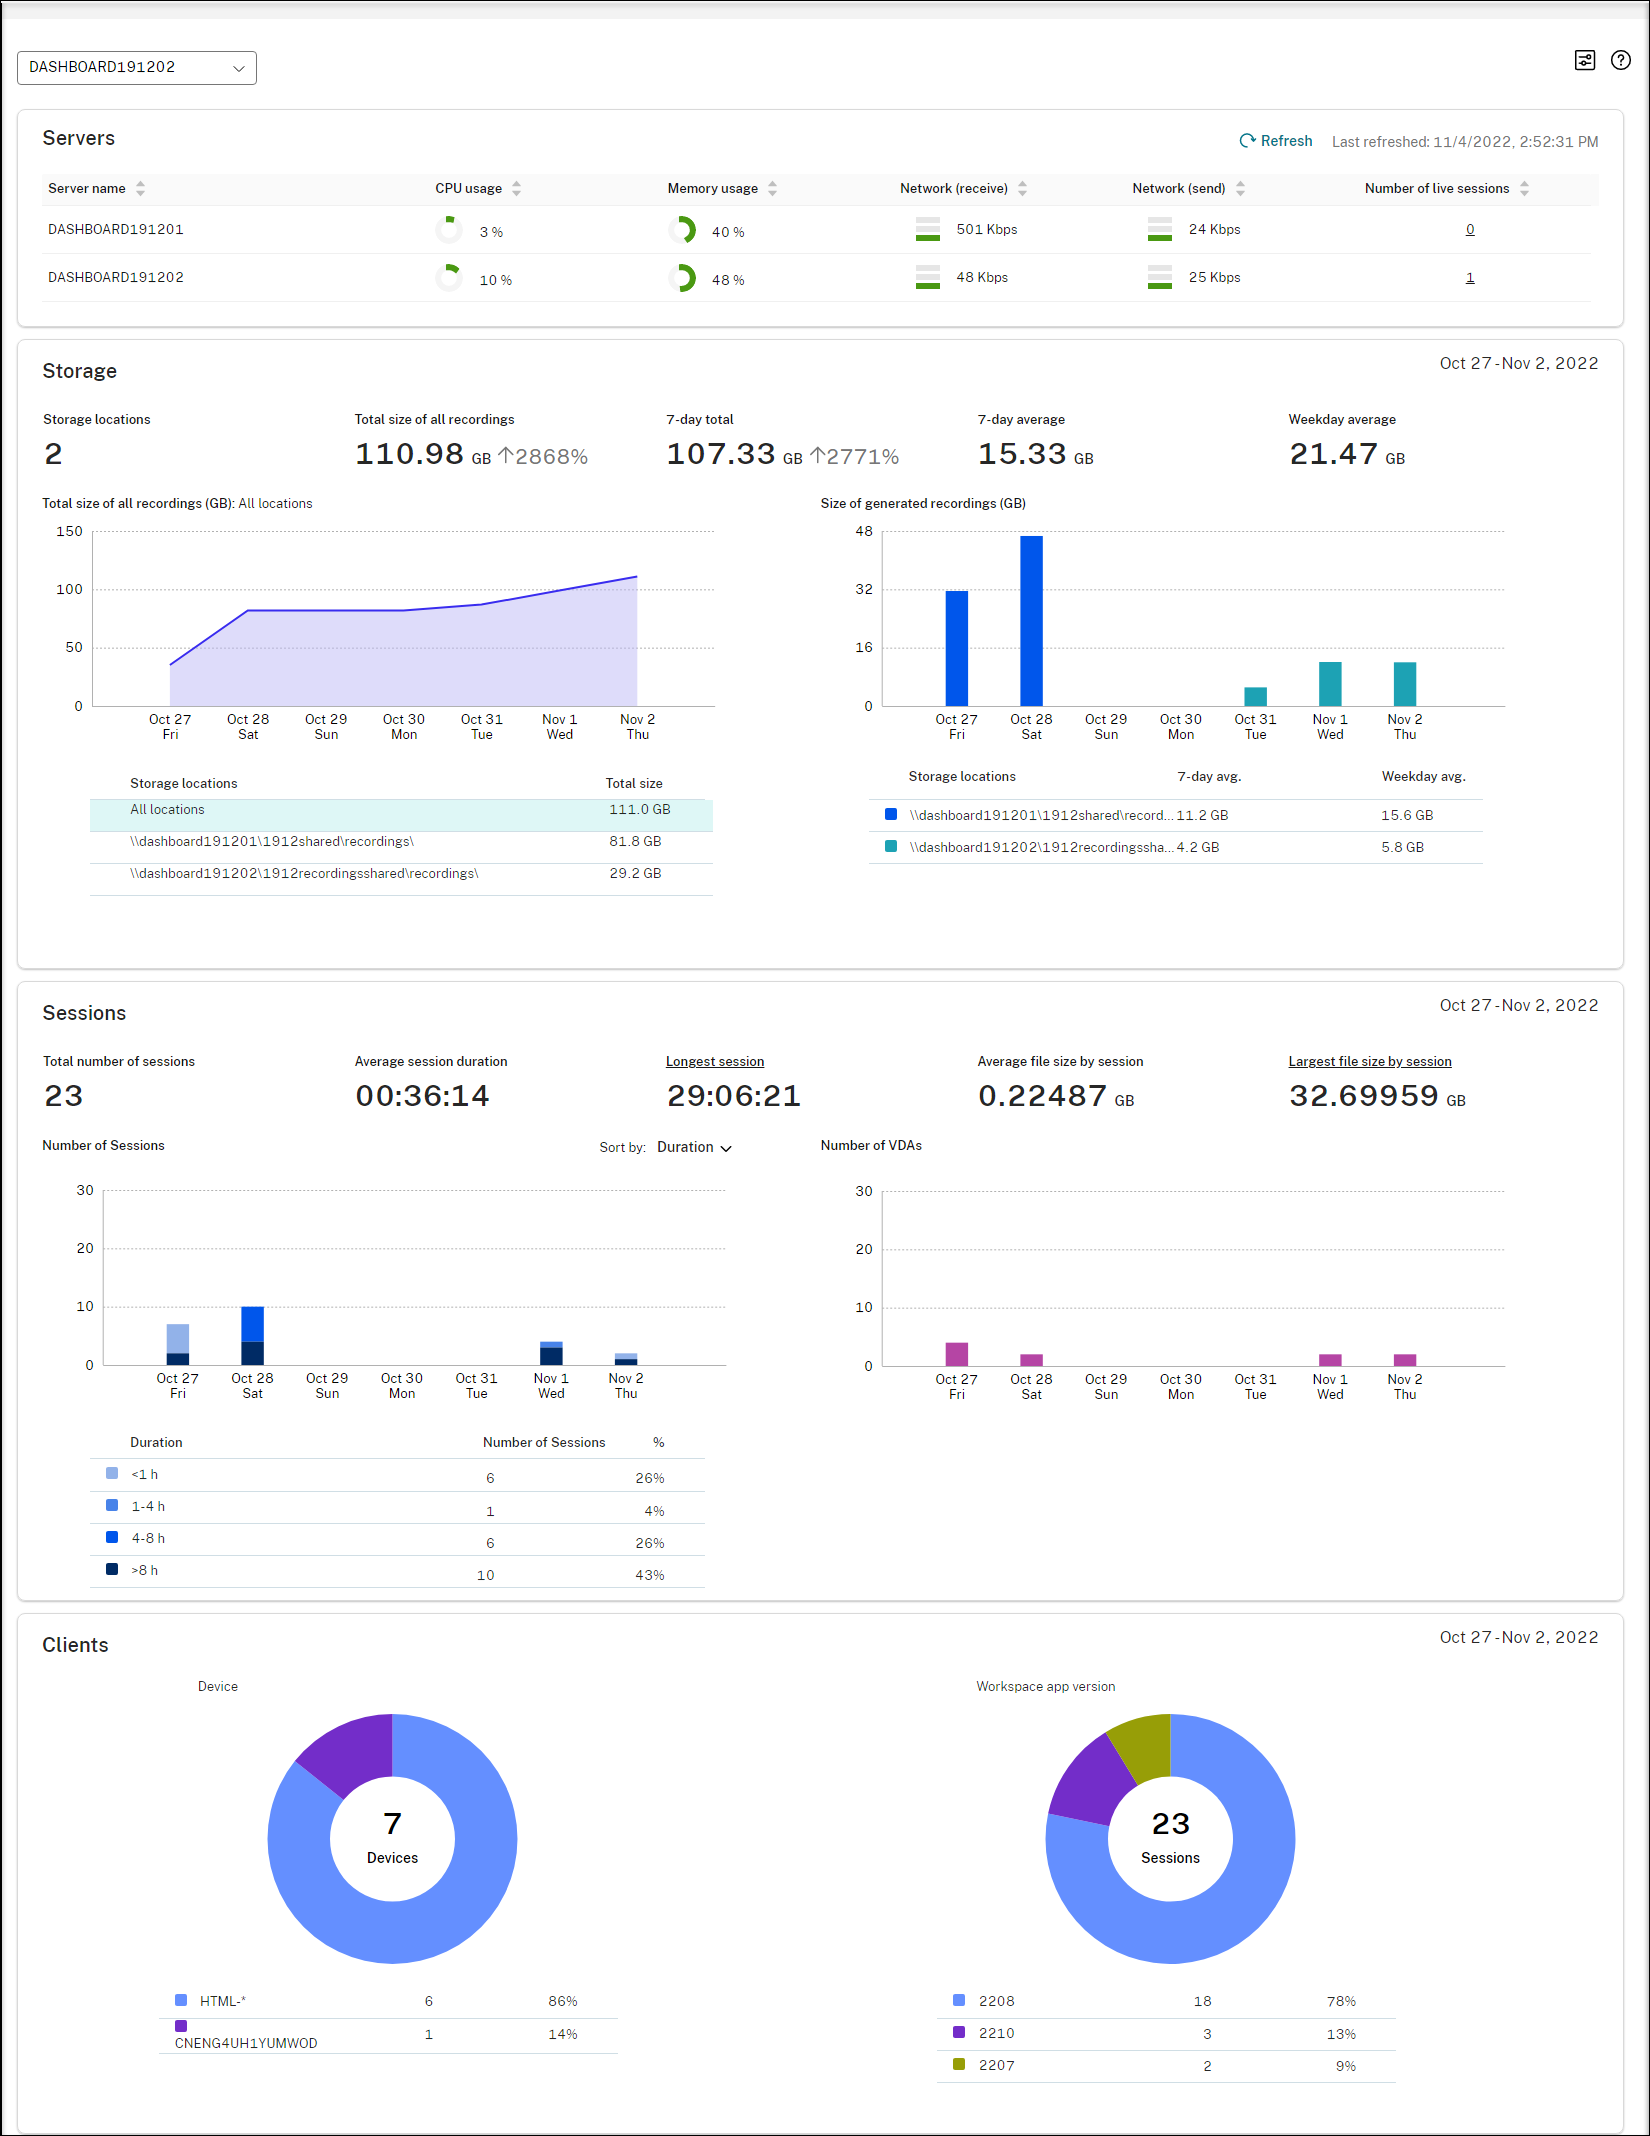
The Session Recording management dashboard helps you gain insights into your system. It lets you monitor various aspects of your system, including:
- Server status
- Recording success rate
- Storage consumption
- Session statistics
- Client device information
- Agent Status
For a sample dashboard, see the following screen capture:
Note:
The recording success rate widget can be shown next to the Servers section if the following conditions are met:
- You are using the cloud client version 7.42.15010.4 or later.
- You have only one site that has available servers and you have turned on the feature toggle on the dashboard settings page of that site.
Tips for using the dashboard
- The dashboard is the new home page for the Session Recording service console. It is available only for Citrix Cloud™ administrators assigned any of the following roles:
- Full access
- Cloud Administrator role
- Session Recording-FullAdmin role
-
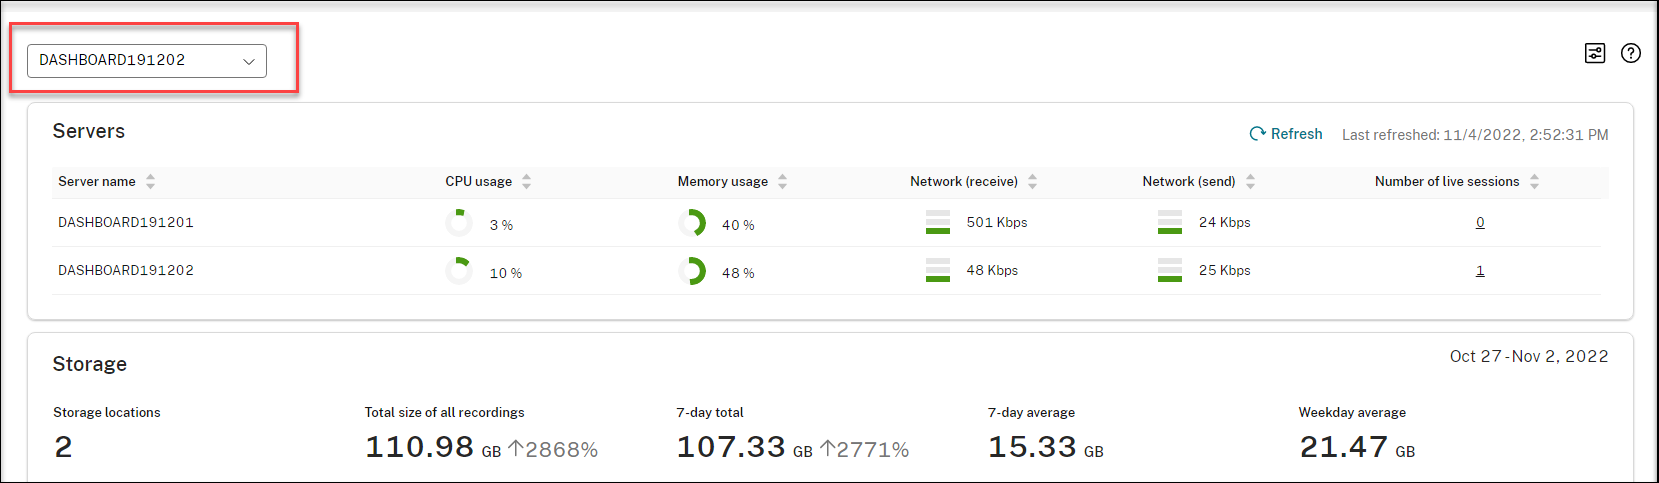
The dashboard presents data relevant to the site that you select from the drop-down menu in the upper-left corner.
-
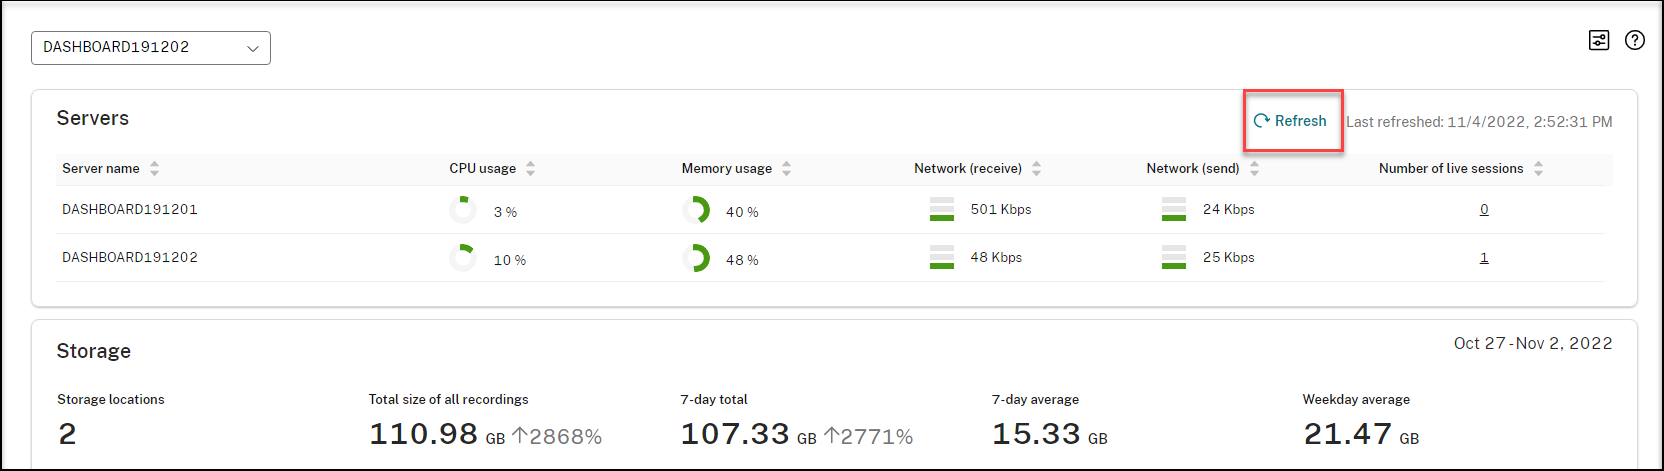
The Servers section refreshes data automatically every 120 seconds. Immediate data refreshes occur when you open the dashboard page, select a site, or click Refresh. The next data refresh does not start until the previous refresh completes. Thus, if you click Refresh during a data refresh, a popup window appears asking you to try again later.
-
The Storage, Sessions, and Clients sections refresh data automatically at a specific time every day. When you select a site or click Refresh on the dashboard page, data is refreshed immediately.
-
Select a site from the drop down list and click on the icon to display and configure the dashboard settings.
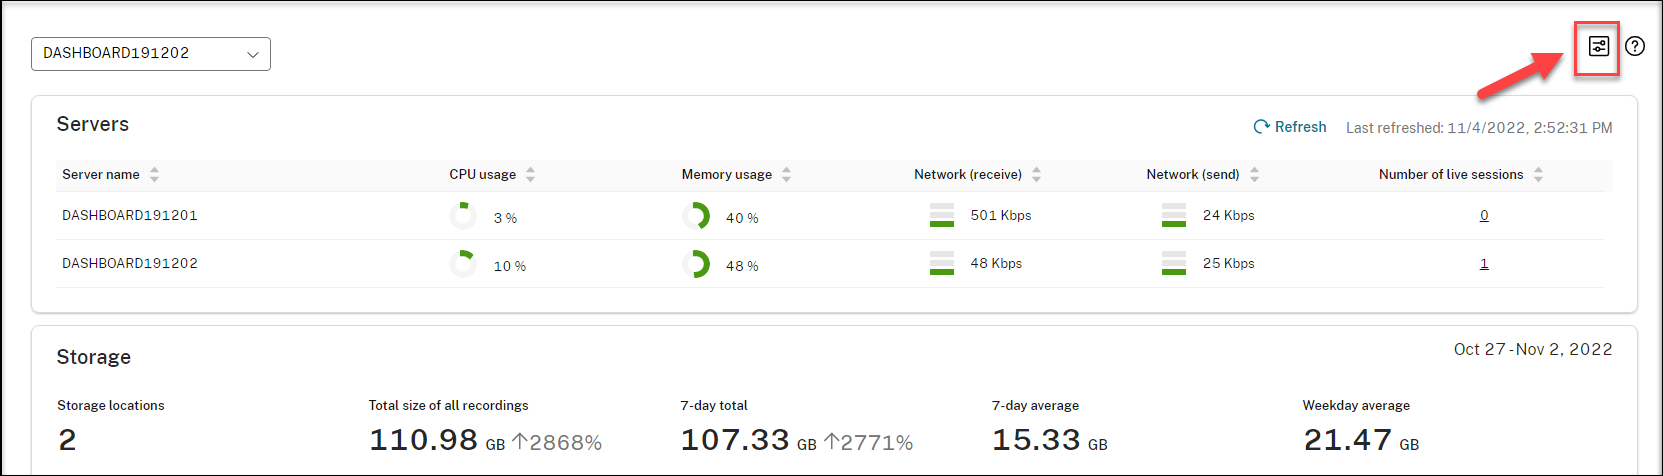
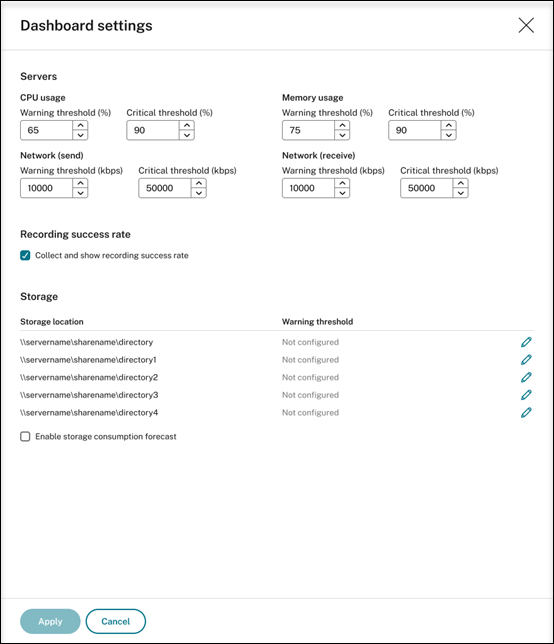
Dashboard settings allow you to:
- Set warning and critical thresholds for:
- CPU usage
- Memory usage
- Network (send)
- Network (receive)
- Enable the feature to collect and show recording success rates.
-
Allocate space in a location for recording storage and set warning thresholds for the space usage. When a warning or critical threshold is reached, the entry is displayed with an orange or red icon.
The storage usage for recorded sessions is influenced by factors such as the chosen image mode and the on-screen activities throughout the sessions. For instance, viewing videos during a virtual session can result in larger recording files.
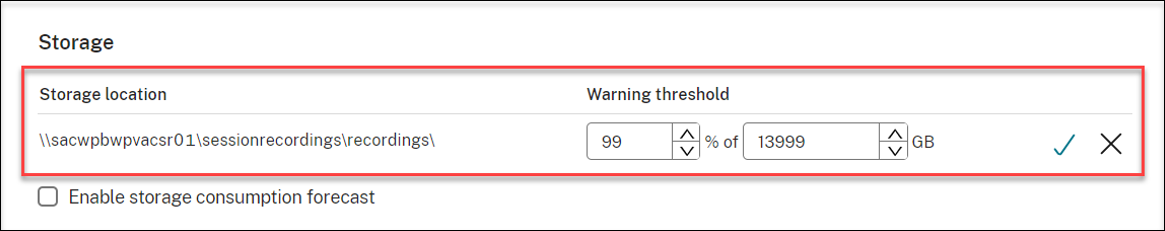
- Enable storage consumption forecast. Storage consumption forecast allows you to predict resource usage and take precautions in advance. After you enable the feature, a storage consumption forecast for the next 7 days can be generated based on sufficient historical consumption data of approximately one month. You can view the forecast on the Total size of all recordings chart of the Storage section.
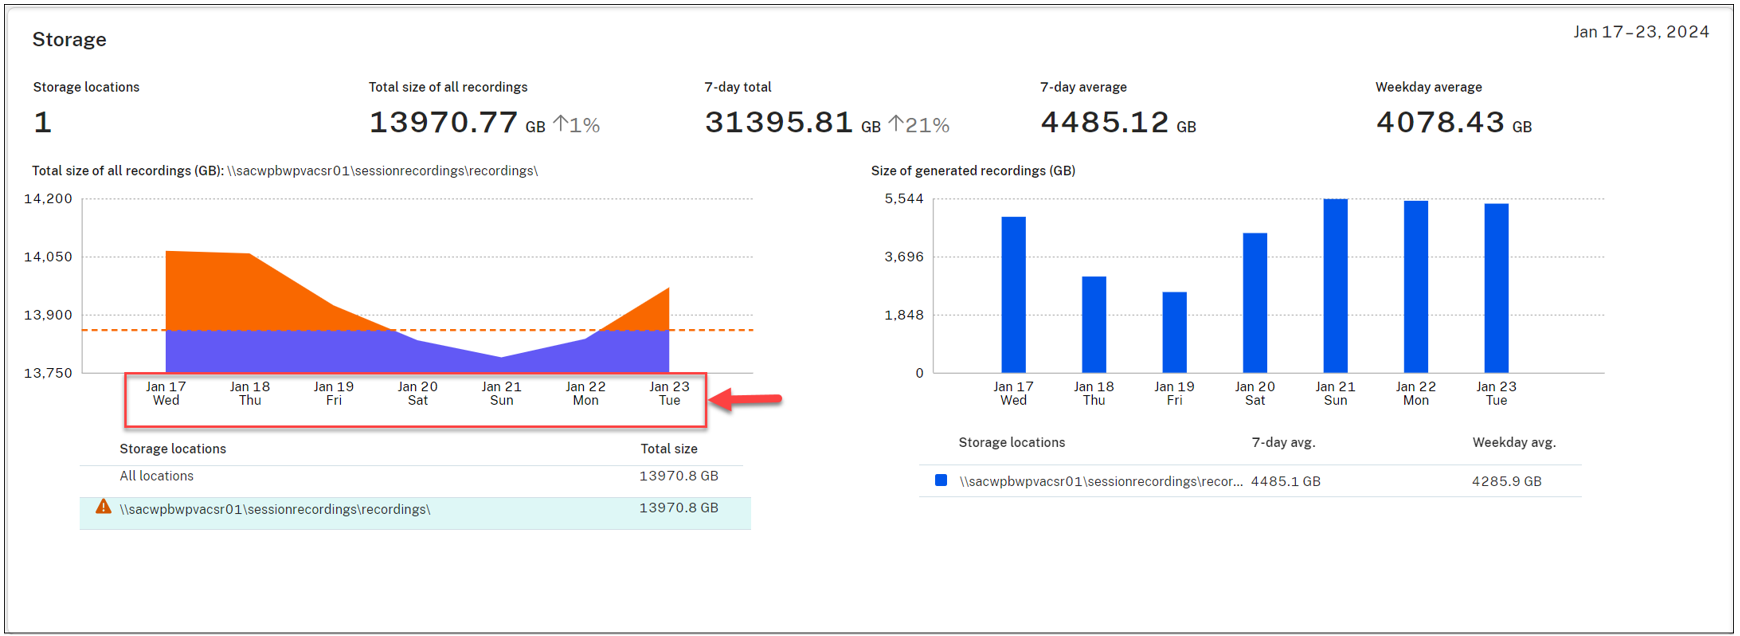
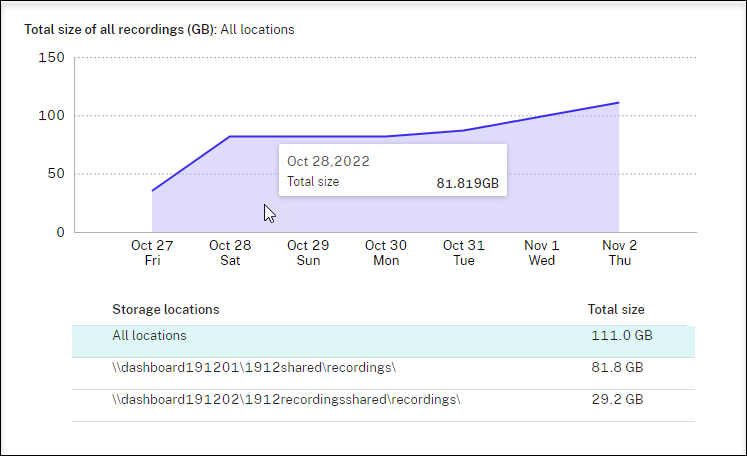
When the storage consumption forecast is not enabled, the Total size of all recordings chart shows only the actual consumption data over the past 7 days. For example:
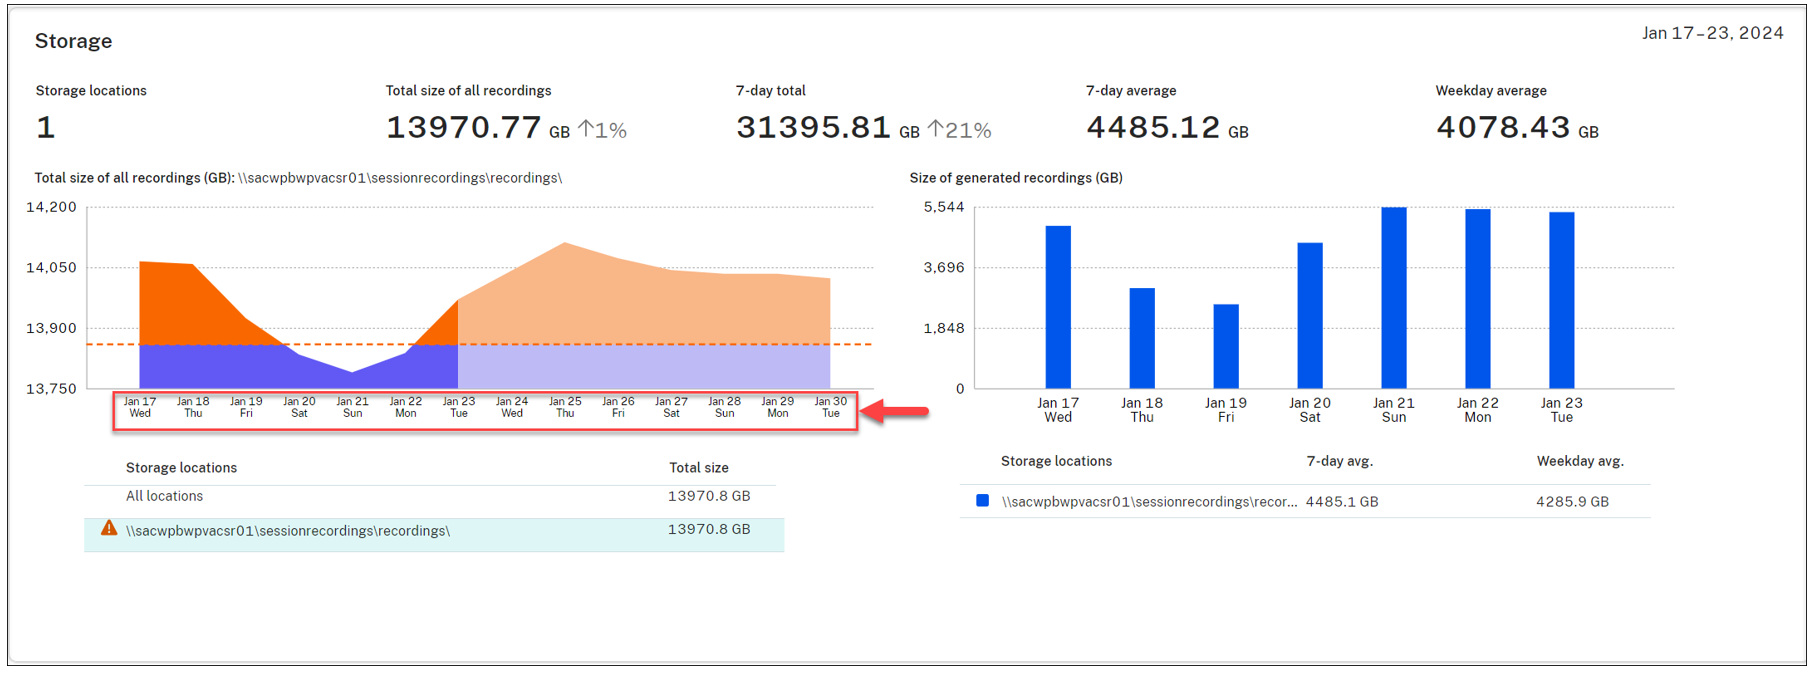
When the storage consumption forecast is enabled, the Total size of all recordings chart shows not only the actual consumption data over the past 7 days but also a consumption forecast for the next 7 days. For example:
Note:
The consumption forecast requires sufficient historical data of approximately one month. For example, see the following prompt:

- Set warning and critical thresholds for:
-
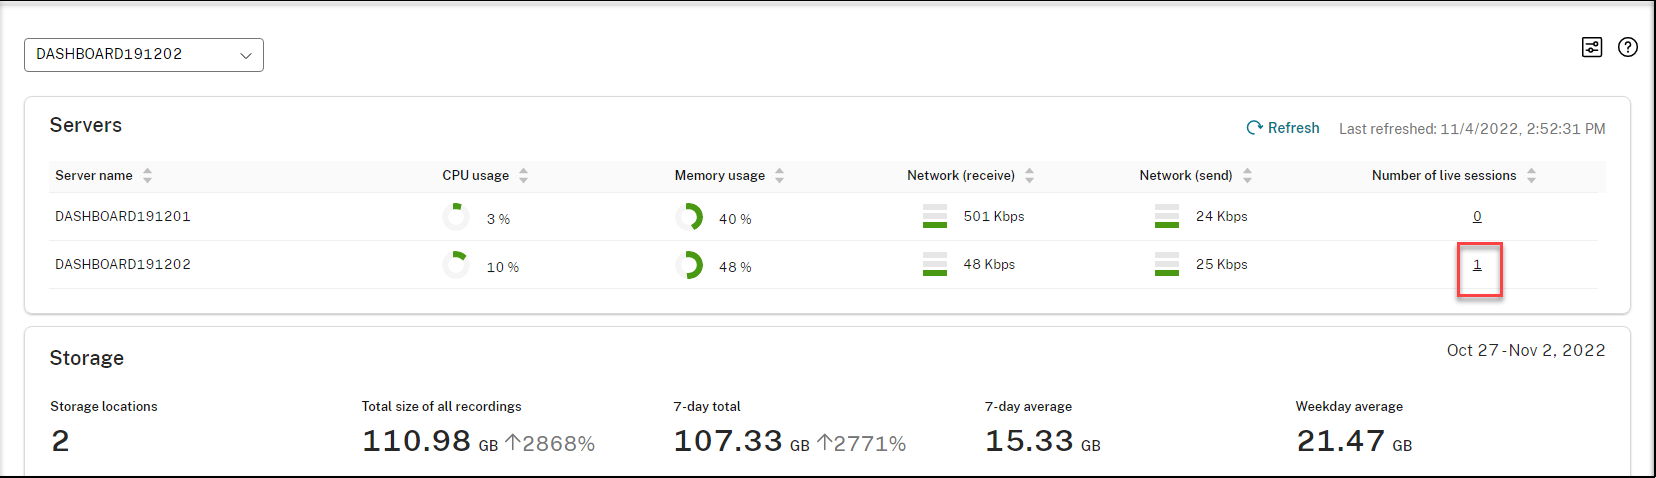
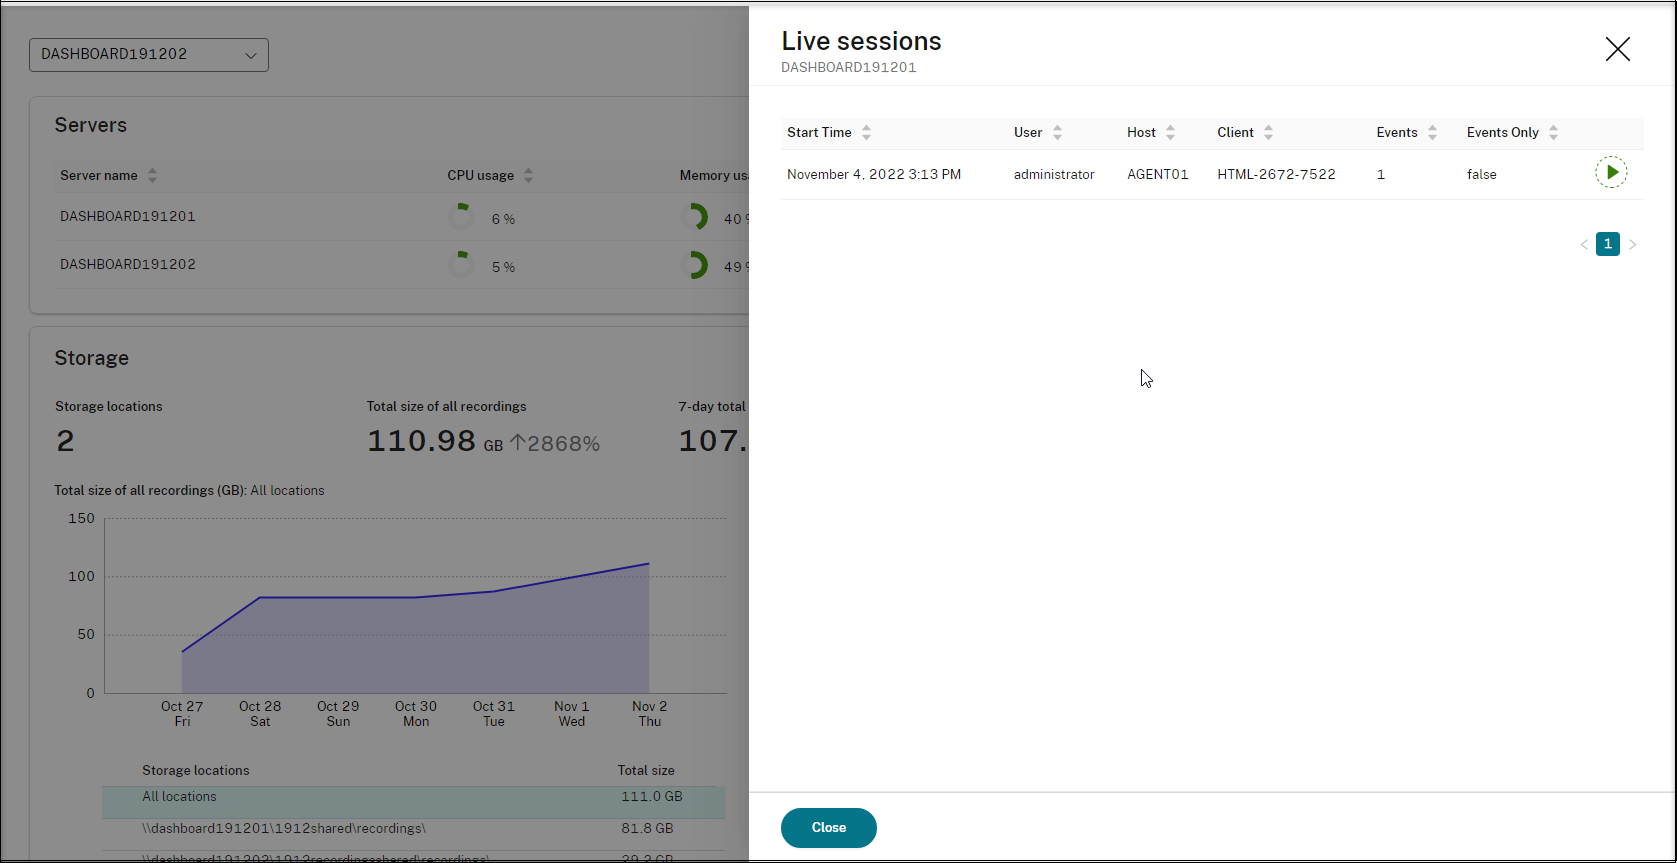
In the Servers section, you can open and play live sessions by clicking on the number of live sessions. For example:
-
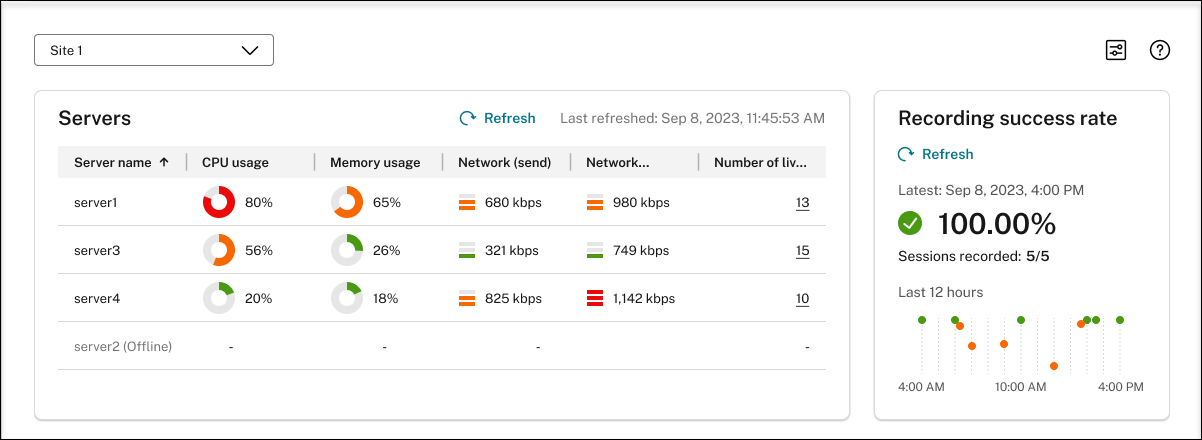
In the Recording success rate section, you can see a widget showing the recording success rates for the current site. The recording success rate is calculated as follows:
Recording success rate = the number of successfully recorded sessions / the total number of sessions matching the currently active recording policy.
Note:
The recording success rate widget can be shown next to the Servers section if the following conditions are met:
- You are using the cloud client version 7.42.15010.4 or later.
- You have only one site that has available servers and you have turned on the feature toggle on the dashboard settings page of that site.
For example:
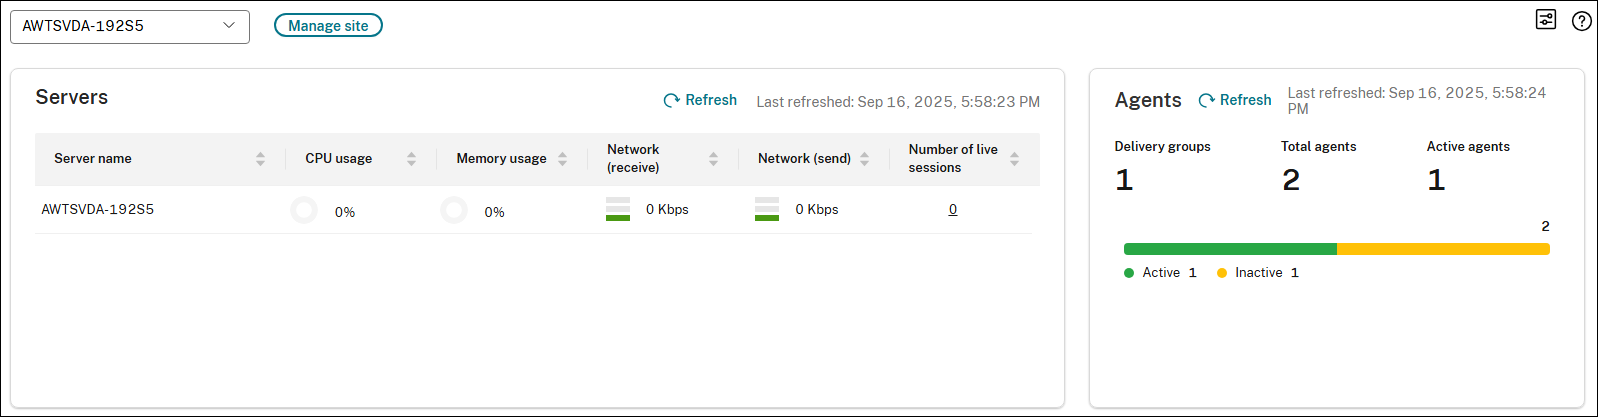
- The Agent section provides a quick summary of the status of all your Session Recording agents if the Session Recording Server/Agent are upgraded to 2503. It displays:
- Total agents: The total number of Session Recording agents connected to the service.
- Active agents: The number of agents that are currently online and sending heartbeats to the service.
- Inactive agents: The number of agents that are currently offline or have not sent a heartbeat within a specified time.
This overview helps you quickly identify any potential issues with agent connectivity and ensure that your recording environment is healthy. For more detailed information about individual agents, including their VDA status, you can navigate to Configuration > Site management.
For Example:
-
In the Total size of all recordings (GB) section, you can switch between storage locations to view relevant data. You can also hover over the chart to view the total size of all recordings on a specific day.
-
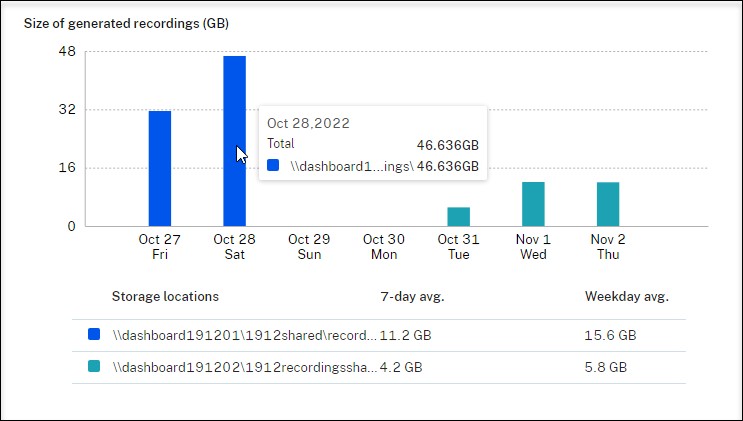
In the Size of generated recordings (GB) section, you can hover over the bar chart corresponding to a day to view the size of newly generated recordings on that day.
-
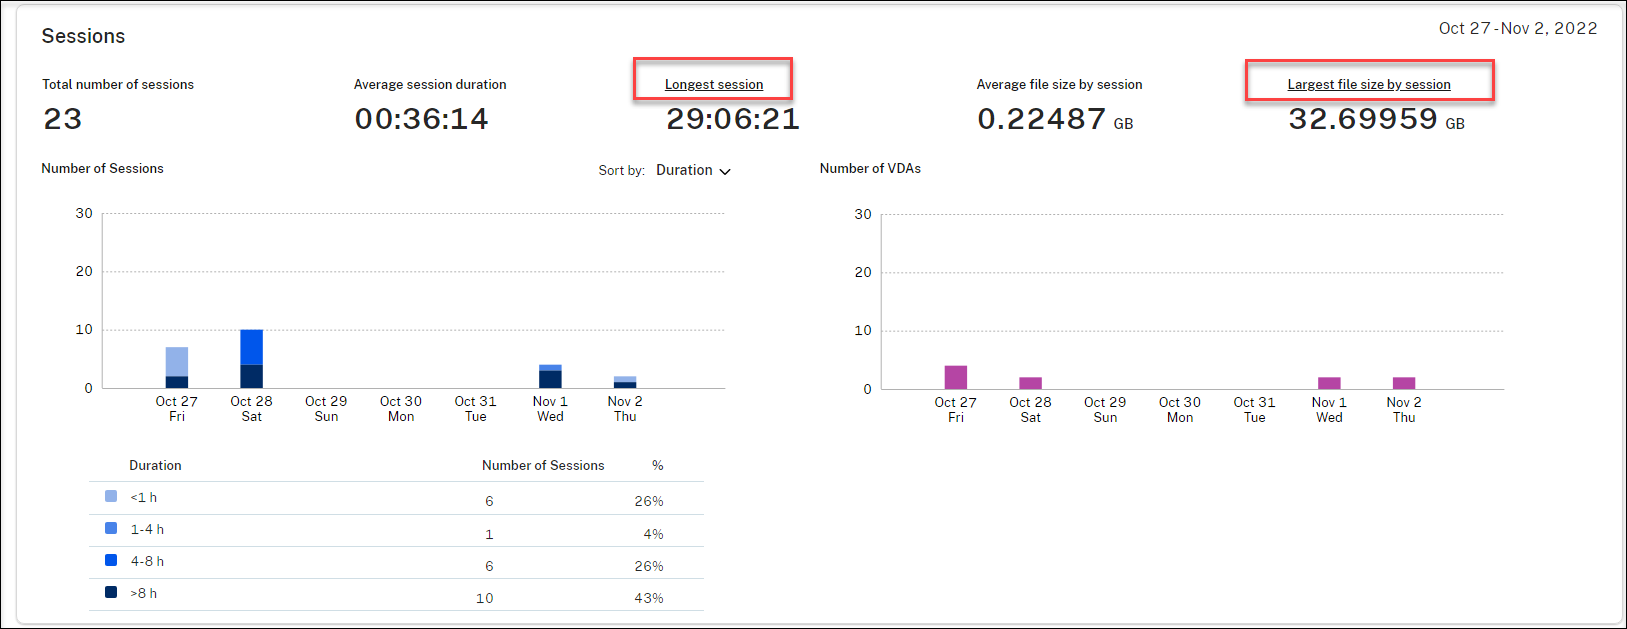
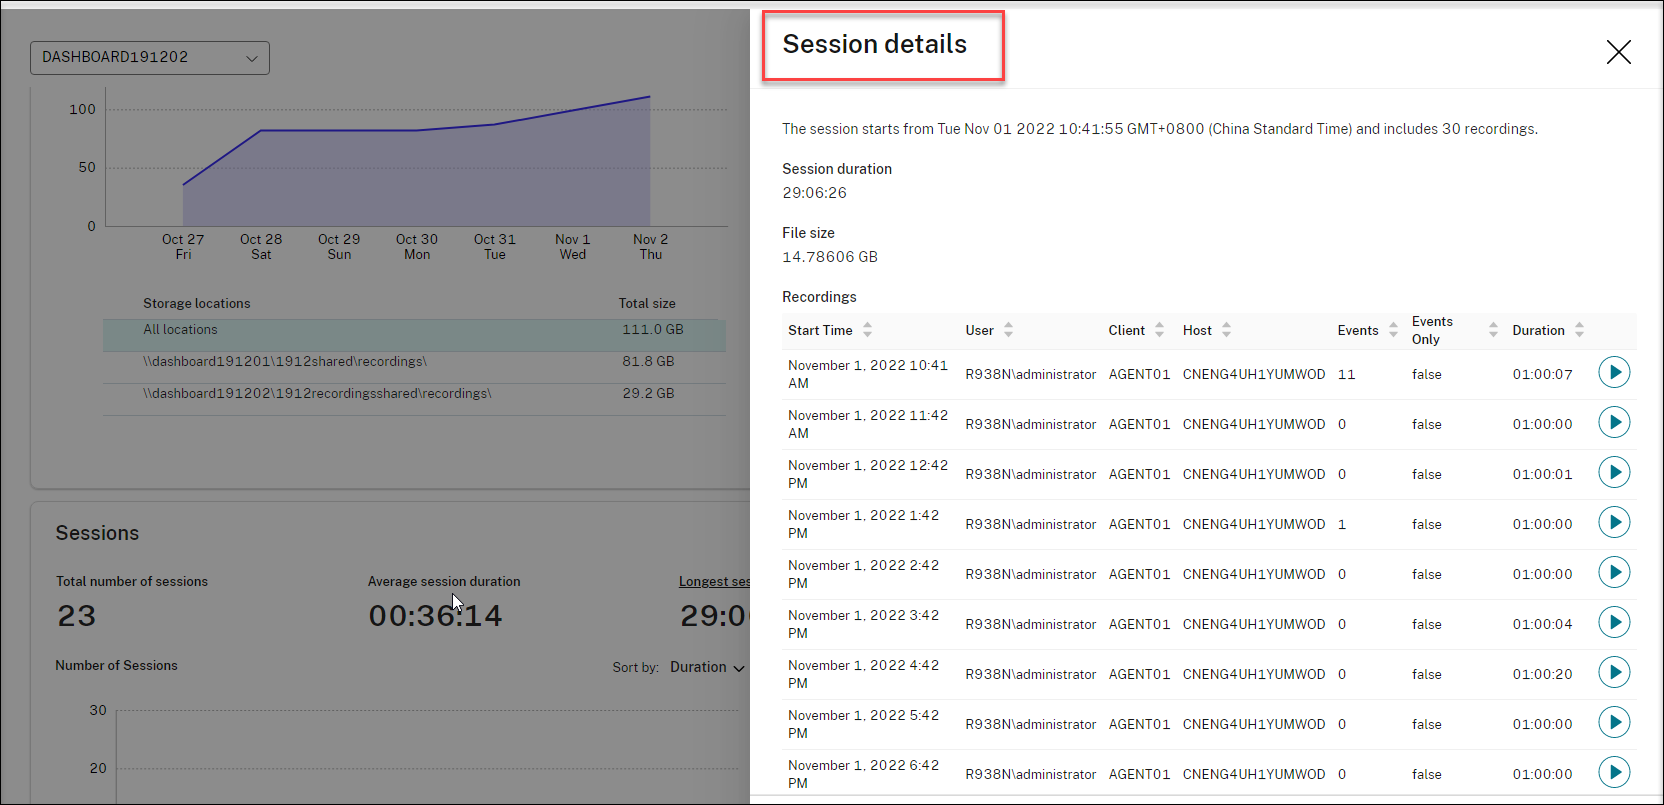
In the Sessions section, you can click Longest session and Largest file size by session to view session details.
-
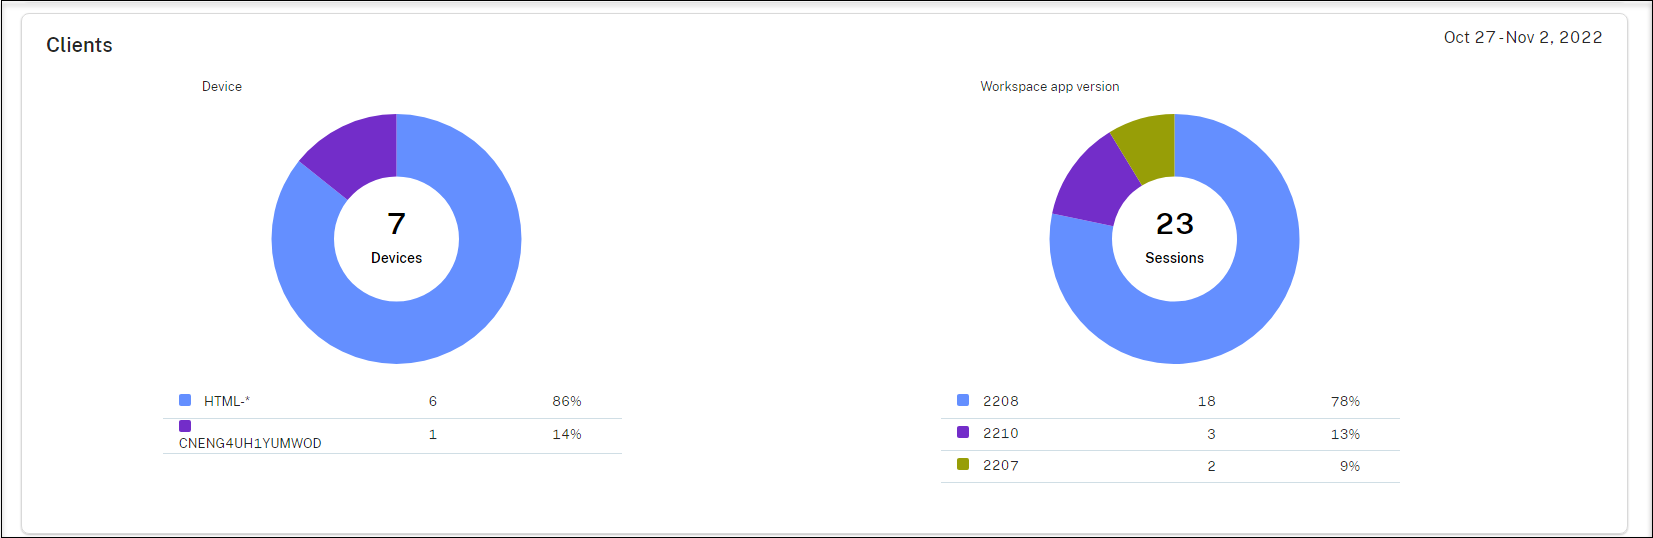
The Clients section shows the percentage of client devices that have different machine name prefixes and the percentage of sessions that run on different versions of Citrix Workspace™ app.
-
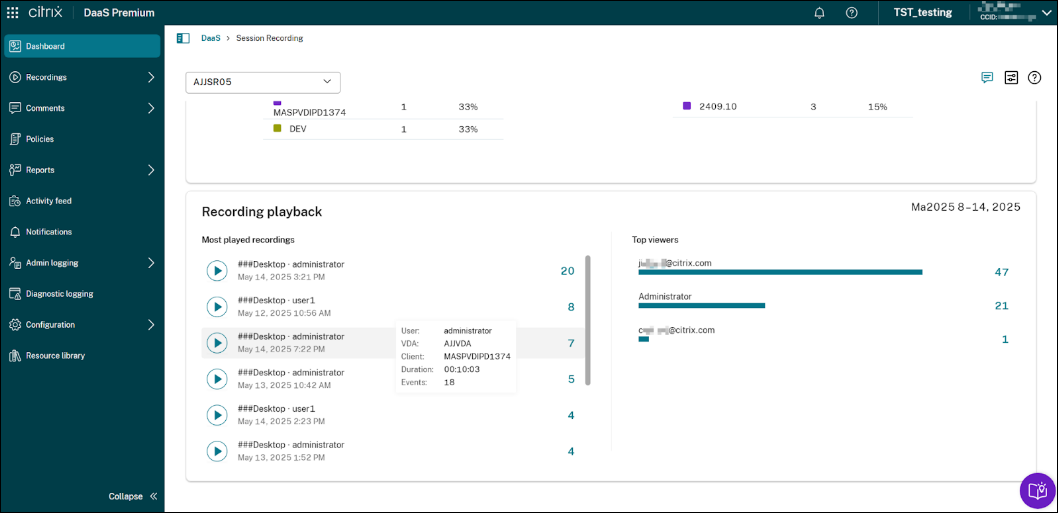
The Recording playback section provides statistics for recording playback. It displays two views: the most played recordings and the top viewers.

In this section:
-
When you hover the mouse over a recording item in the “Most played recordings” view (left side), detailed information about that recording is displayed.
-
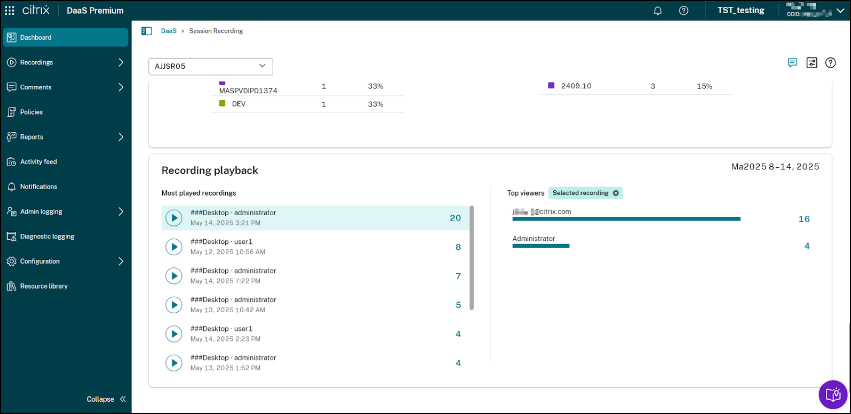
If you click on a recording item in the “Most played recordings” view, the “Top viewers” view (right side) shows the top 10 users who have played that specific recording.
-
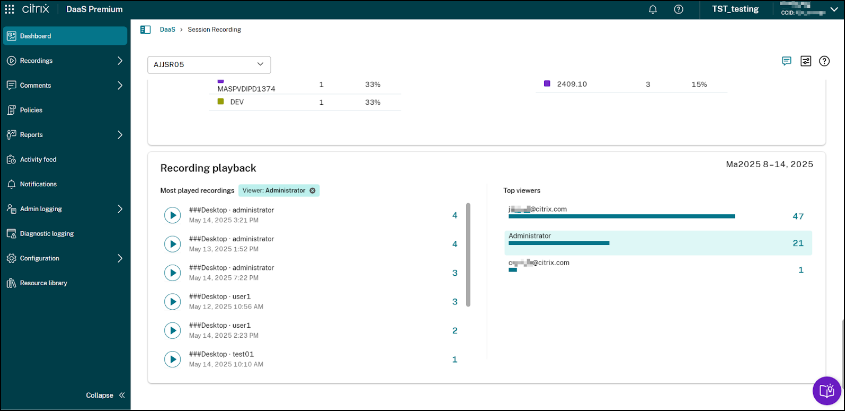
Conversely, if you click on a viewer item in the “Top viewers” view, the “Most played recordings” view will update to show the top 10 recordings played by that specific viewer.
-