Third-party SIEM integration
Overview
Session Recording provides the capability to capture various events in recorded sessions. You can upload a selected set of the event data to the Session Recording service and forward it to a third-party Security Information and Event Management (SIEM) system for further analysis. Currently, the Session Recording service supports integration with Splunk (both Splunk Cloud and Splunk Enterprise) and Microsoft Sentinel.
Integrating with a third-party SIEM platform enhances your organization’s security posture by leveraging advanced analytics and correlation capabilities to detect and respond to potential threats more effectively.
Configuration
-
Enable SIEM integration.
-
Select Configuration > SIEM Integration from the left navigation of the Session Recording service.

-
Enable Microsoft Sentinel, Splunk, or both as needed. Then, click the Configure icon next to the toggle to configure the destination and data source.
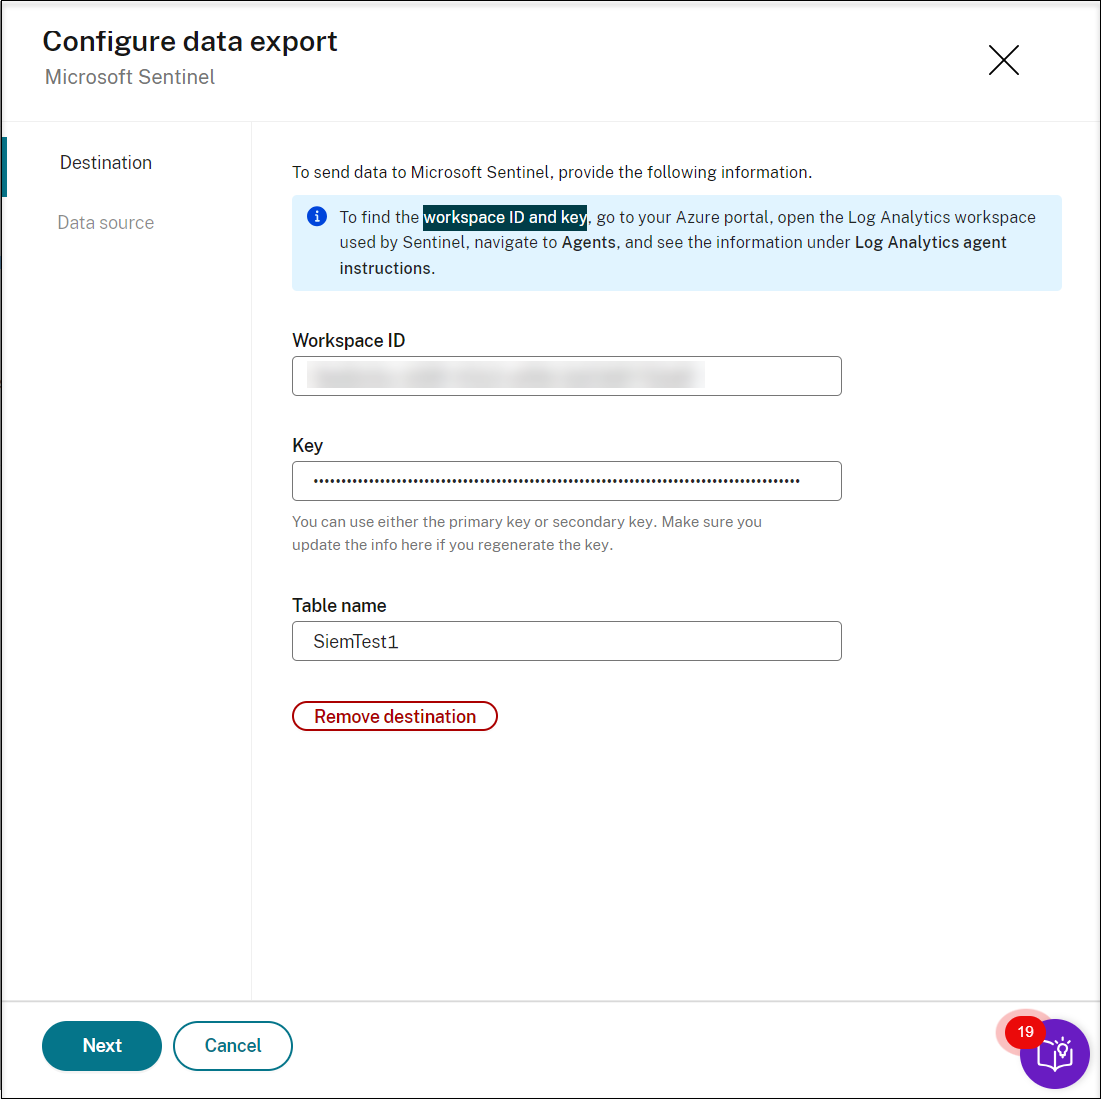
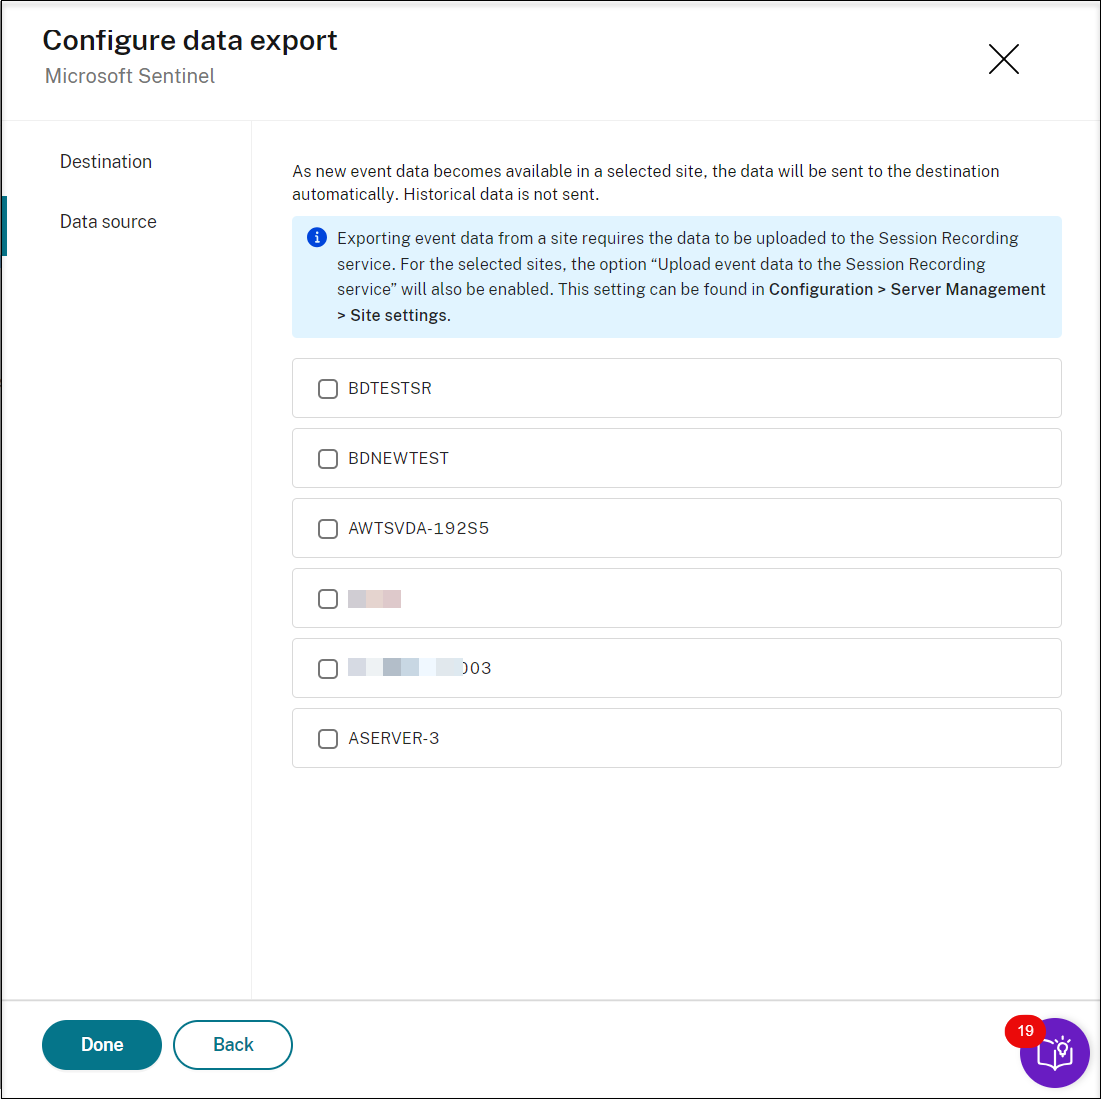
To send data to Microsoft Sentinel, provide the workspace ID and key for the Microsoft Sentinel destination and select the target sites as the source of data to be sent. Only sites containing Session recording version 2411 and later are supported for SIEM integration.
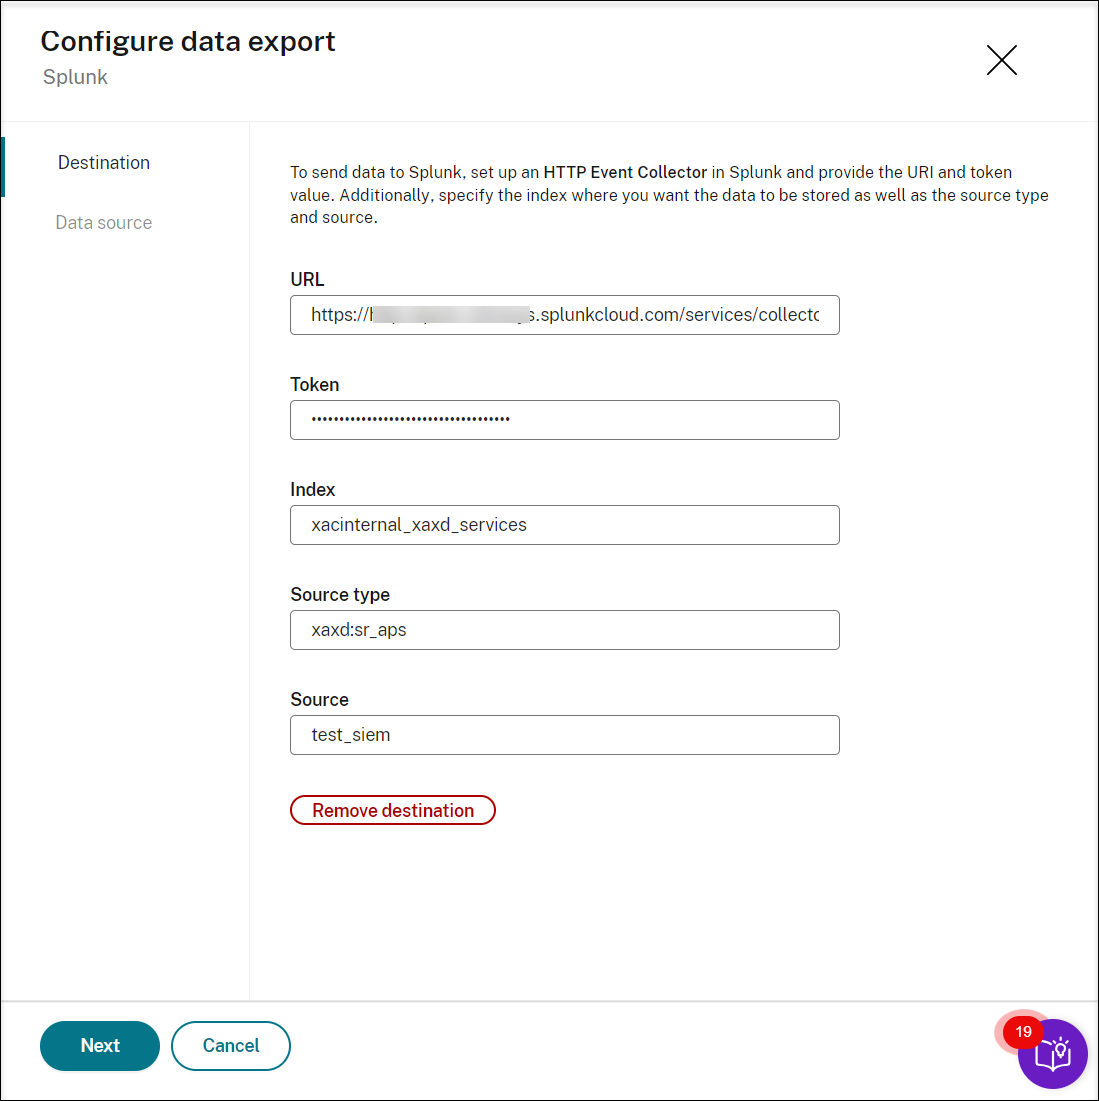
To send data to Splunk, set up an HTTP Event Collector in Splunk. For instructions, see the Splunk documentation: Set up and use HTTP Event Collector in Splunk Web. The Session Recording service supports both Splunk Cloud and Splunk Enterprise. If you are using Splunk Enterprise, ensure that inbound connectivity from the Session Recording service (currently hosted on Microsoft Azure) to your Splunk Enterprise is configured.
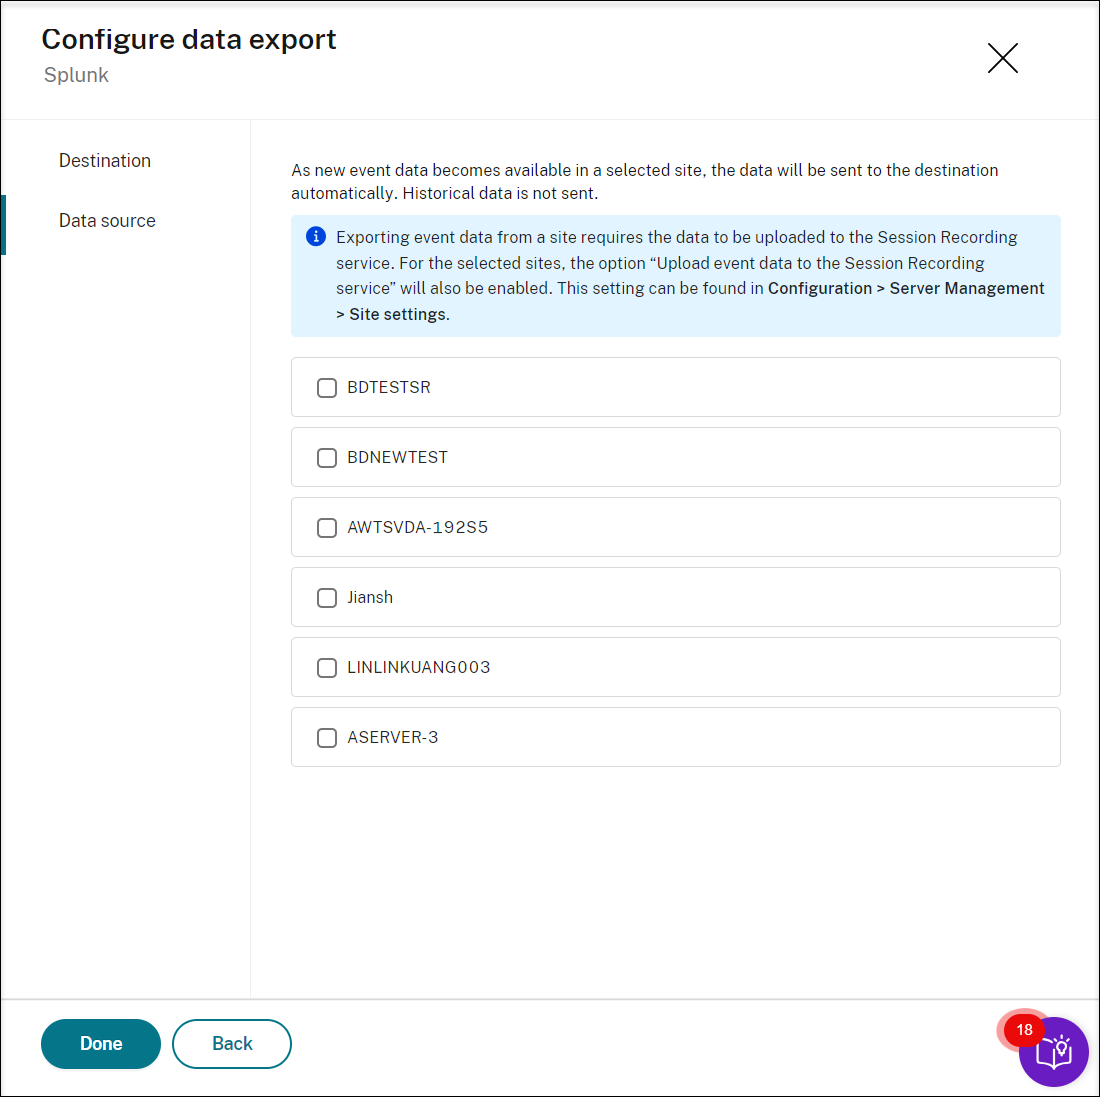
Provide the URL, token value, and specify the index where you want the data to be stored in addition to the source type and source. Then, similar to Microsoft Sentinel, select the target sites as the source of data to be sent. Only sites containing Session recording version 2411 and later are supported for SIEM integration.
-
-
Specify events to forward.
You must specify the types of events to be uploaded to the Session Recording service and forwarded to the SIEM platforms you specified earlier. To do so, complete the following steps:
-
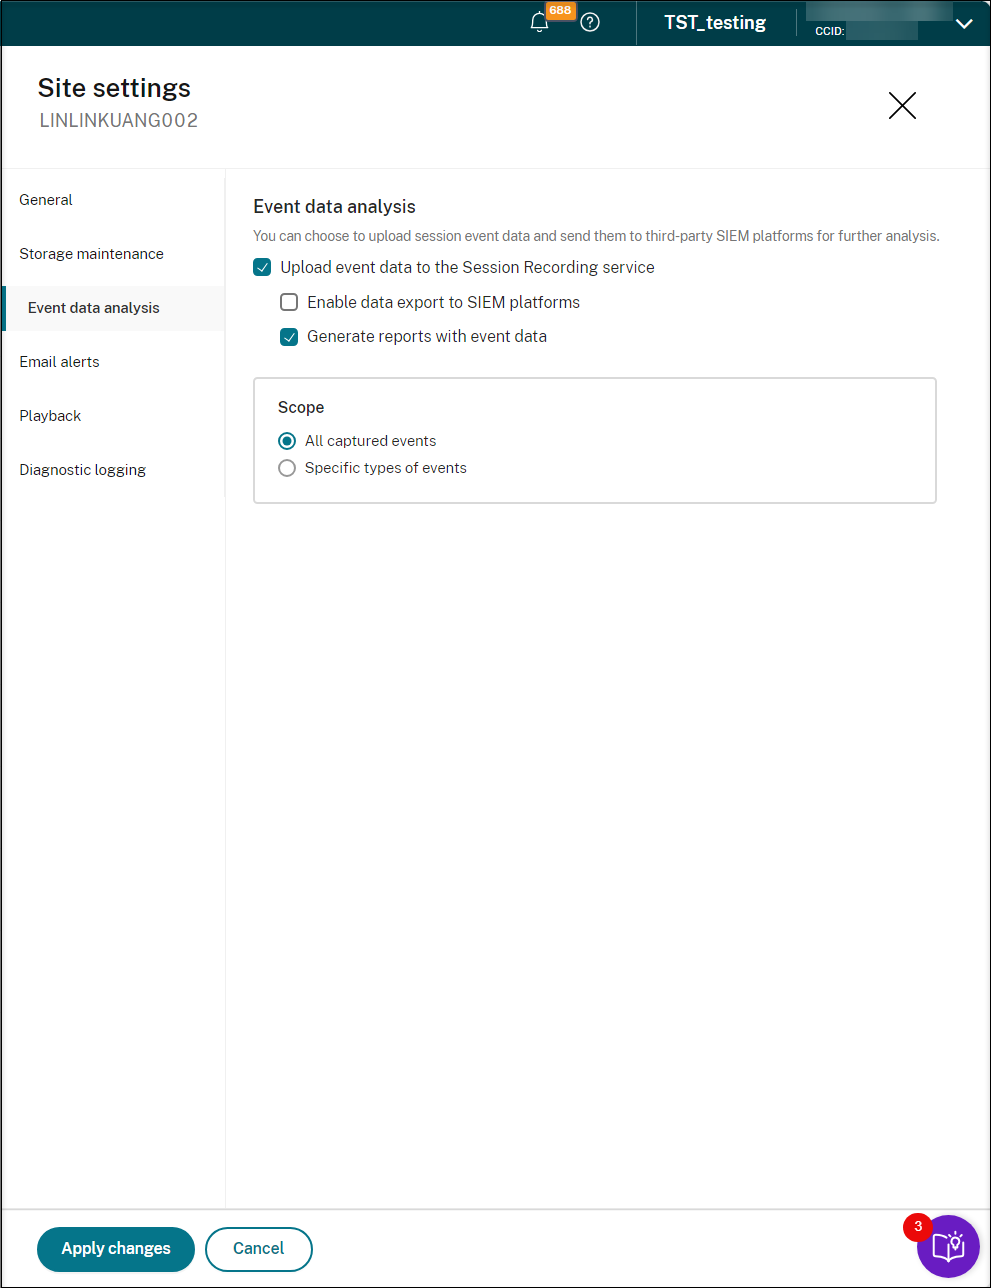
Go to Site settings for each of the sites that you selected earlier as the data source. For example:
-
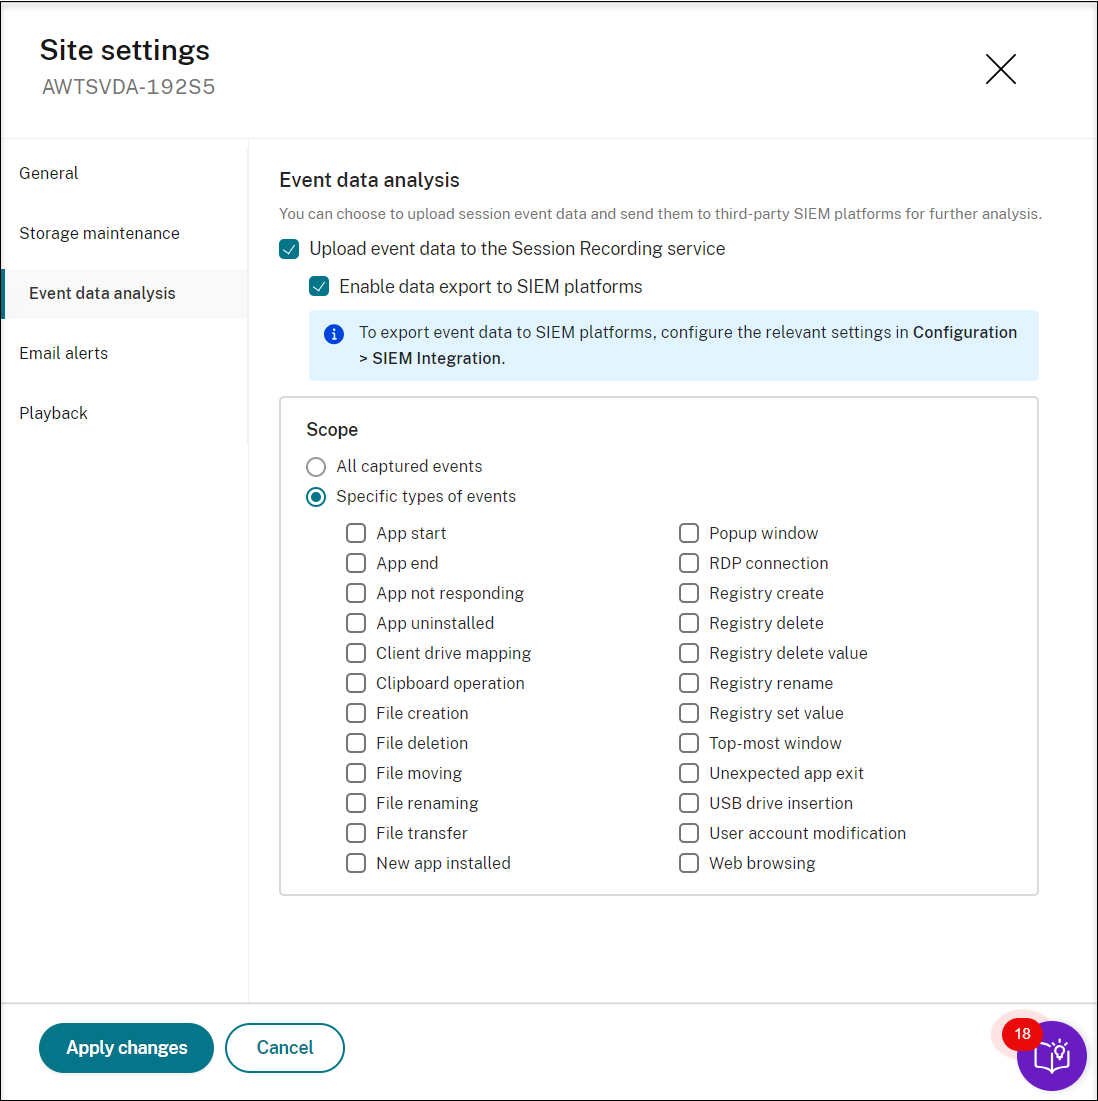
Select Upload event data to the Session Recording service and then select Enable data export to SIEM platforms. In the Scope section, specify the types of events to forward. For example:
-
-
Test the integration.
After configuring the integration, test it to ensure that events are being forwarded correctly to the SIEM platforms specified.
-
Monitor and adjust.
Continuously monitor the integration to ensure it is functioning as expected. Adjust the configuration as needed to fine-tune the event forwarding and improve the accuracy of the alerts.
-
Visualize event data.
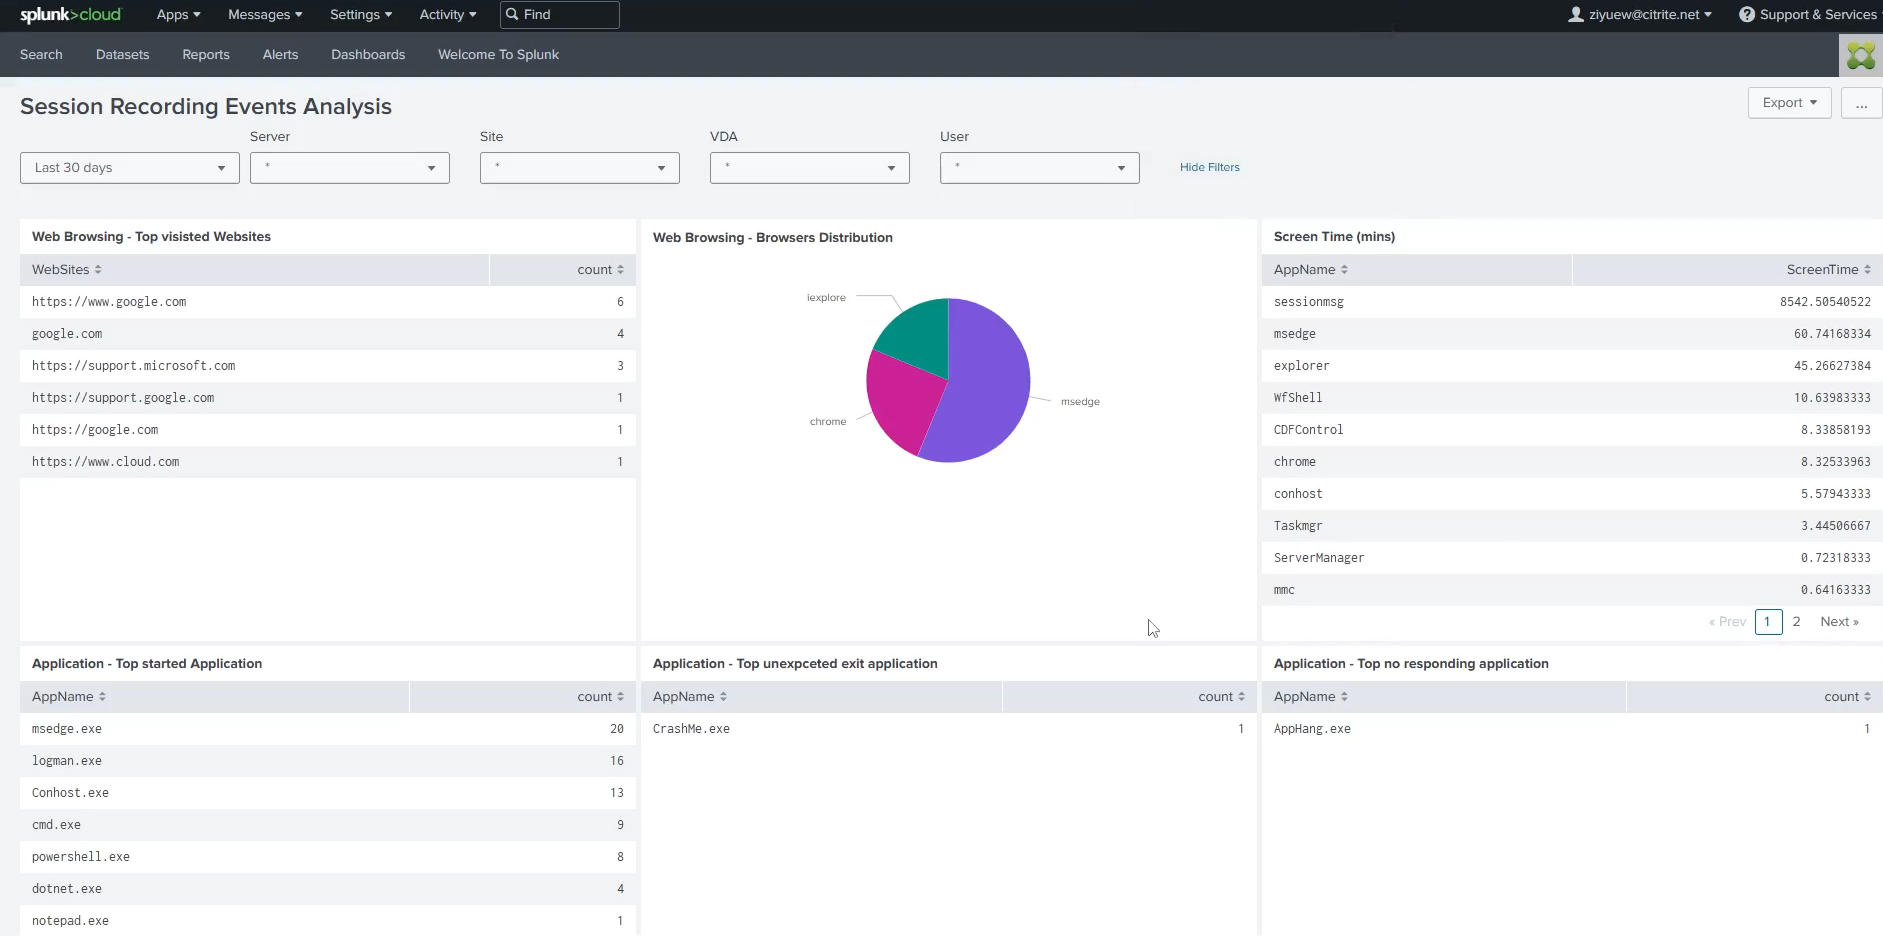
You can visualize event data in Microsoft Sentinel and Splunk. The following are example views:
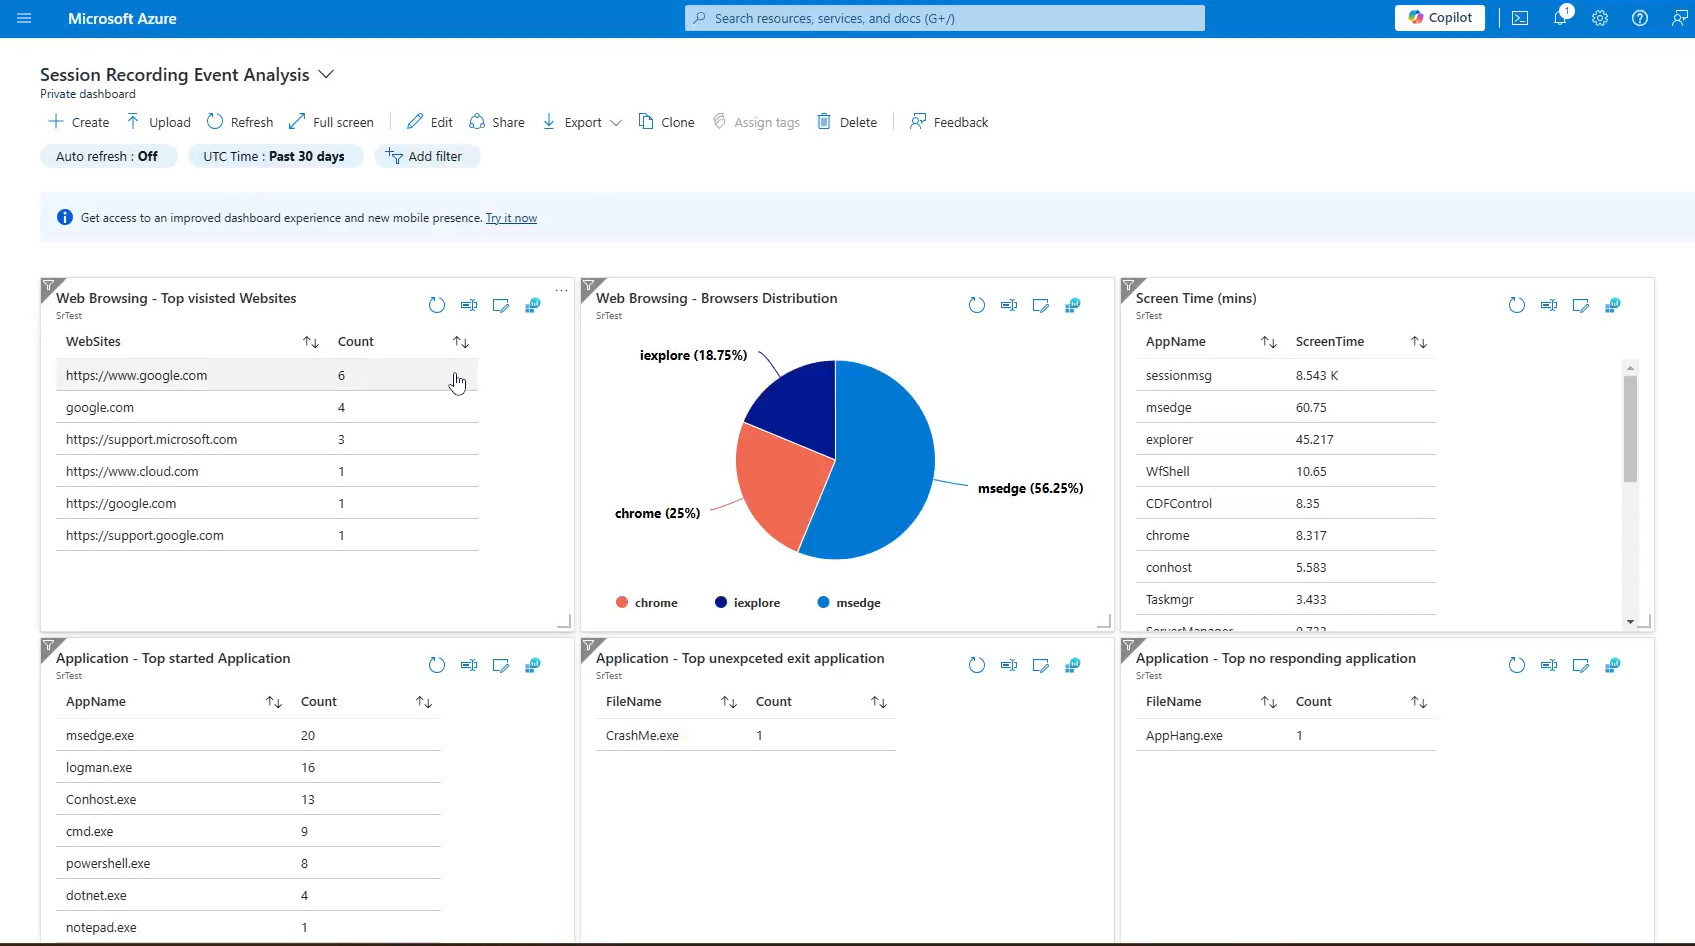
To visualize event data in Microsoft Sentinel, contact Citrix Technical Support.
To quickly import and visualize event data in Splunk, use the following dashboard template by customizing the search queries such as
,, and `` and visualizations to match your data:<form version="1.1" theme="light"> <label>Session Recording Events Analysis</label> <fieldset submitButton="false"> <input type="time" token="time_field"> <label></label> <default> <earliest>-24h@h</earliest> <latest>now</latest> </default> </input> <input type="dropdown" token="Server"> <label>Server</label> <default>*</default> <initialValue>*</initialValue> <fieldForValue>Server</fieldForValue> <search> <query>index= sourcetype= source= | table dvc | rename dvc as Server | dedup Server | sort Server</query> <earliest>$time_field.earliest$</earliest> <latest>$time_field.latest$</latest> </search> </input> <input type="dropdown" token="Site"> <label>Site</label> <default>*</default> <initialValue>*</initialValue> <fieldForValue>Site</fieldForValue> <search> <query>index="" sourcetype= source= | table tenant.srSiteId | rename tenant.srSiteId as Site | dedup Site | sort Site</query> <earliest>$time_field.earliest$</earliest> <latest>$time_field.latest$</latest> </search> </input> <input type="dropdown" token="VDA"> <label>VDA</label> <default>*</default> <initialValue>*</initialValue> <fieldForValue>VDA</fieldForValue> <search> <query>index= sourcetype= source= | table payload.deviceId | rename payload.deviceId as VDA | dedup VDA | sort VDA</query> <earliest>$time_field.earliest$</earliest> <latest>$time_field.latest$</latest> </search> </input> <input type="dropdown" token="User"> <label>User</label> <default>*</default> <initialValue>*</initialValue> <fieldForValue>User</fieldForValue> <search> <query>index= sourcetype= source= | table payload.user | rename payload.user as User | dedup User | sort User</query> <earliest>$time_field.earliest$</earliest> <latest>$time_field.latest$</latest> </search> </input> </fieldset> <row> <panel> <table> <title>Web Browsing - Top visisted Websites</title> <search> <query>index= sourcetype= source= | search type=Citrix.EventMonitor.WebBrowsing | spath payload.ExtEventData1 | stats count by payload.ExtEventData1 | sort count desc | rename payload.ExtEventData1 as WebSites</query> <earliest>$time_field.earliest$</earliest> <latest>$time_field.latest$</latest> <sampleRatio>1</sampleRatio> </search> <option name="dataOverlayMode">none</option> <option name="drilldown">none</option> <option name="percentagesRow">false</option> <option name="rowNumbers">false</option> <option name="totalsRow">false</option> <option name="wrap">true</option> <format type="color" field="FunctionFailed"> <colorPalette type="list">[#118832,#D41F1F]</colorPalette> <scale type="threshold">1</scale> </format> </table> </panel> <panel> <chart> <title>Web Browsing - Browsers Distribution</title> <search> <query>index= sourcetype= source= | search type=Citrix.EventMonitor.WebBrowsing | spath payload.ExtEventData3 | stats count by payload.ExtEventData3|sort count desc</query> <earliest>$time_field.earliest$</earliest> <latest>$time_field.latest$</latest> <sampleRatio>1</sampleRatio> </search> <option name="charting.chart">pie</option> <option name="charting.drilldown">none</option> <option name="refresh.display">progressbar</option> </chart> </panel> <panel> <table> <title>Screen Time (mins)</title> <search> <query>index= sourcetype= source= | spath "payload.type" | search "payload.type"="Citrix.EventMonitor.TopMost" | rename payload.ExtEventData1 as AppName, payload.deviceId as DeviceId | eval time=strptime(st, "%Y-%m-%dT%H:%M:%S.%7N") | sort DeviceId time | streamstats current=f window=1 last(time) as last_time by DeviceId | eval time_diff = if(isnull(last_time), null(), time - last_time) | table time, DeviceId, AppName, time_diff |eval time_diff = time_diff/60 | stats sum(time_diff) by AppName |sort by sum(time_diff) desc |rename sum(time_diff) as ScreenTime</query> <earliest>$time_field.earliest$</earliest> <latest>$time_field.latest$</latest> <sampleRatio>1</sampleRatio> </search> <option name="dataOverlayMode">none</option> <option name="drilldown">none</option> <option name="percentagesRow">false</option> <option name="refresh.display">progressbar</option> <option name="rowNumbers">false</option> <option name="totalsRow">false</option> <option name="wrap">true</option> <format type="color" field="FunctionFailed"> <colorPalette type="list">[#118832,#D41F1F]</colorPalette> <scale type="threshold">1</scale> </format> </table> </panel> </row> <row> <panel> <table> <title>Application - Top started Application</title> <search> <query>index= sourcetype= source= | search type=Citrix.EventMonitor.AppStart | spath payload.ExtEventData2 | stats count by payload.ExtEventData2 | sort count desc | rename payload.ExtEventData2 as AppName</query> <earliest>$time_field.earliest$</earliest> <latest>$time_field.latest$</latest> <sampleRatio>1</sampleRatio> </search> <option name="dataOverlayMode">none</option> <option name="drilldown">none</option> <option name="percentagesRow">false</option> <option name="rowNumbers">false</option> <option name="totalsRow">false</option> <option name="wrap">true</option> <format type="color" field="FunctionFailed"> <colorPalette type="list">[#118832,#D41F1F]</colorPalette> <scale type="threshold">1</scale> </format> </table> </panel> <panel> <table> <title>Application - Top unexpceted exit application</title> <search> <query>index= sourcetype= source= | search type=Citrix.EventMonitor.UnexpectedAppExit | spath payload.ExtEventData2 | stats count by payload.ExtEventData2 | sort count desc | rename payload.ExtEventData2 as AppPath | eval AppNameSplit = split(AppPath, "\\") | eval AppName = mvindex(AppNameSplit, -1) | table AppName|stats count by AppName</query> <earliest>$time_field.earliest$</earliest> <latest>$time_field.latest$</latest> <sampleRatio>1</sampleRatio> </search> <option name="dataOverlayMode">none</option> <option name="drilldown">none</option> <option name="percentagesRow">false</option> <option name="refresh.display">progressbar</option> <option name="rowNumbers">false</option> <option name="totalsRow">false</option> <option name="wrap">true</option> <format type="color" field="FunctionFailed"> <colorPalette type="list">[#118832,#D41F1F]</colorPalette> <scale type="threshold">1</scale> </format> </table> </panel> <panel> <table> <title>Application - Top no responding application</title> <search> <query>index= sourcetype= source= | search type=Citrix.EventMonitor.AppNotResponding | spath payload.ExtEventData2 | stats count by payload.ExtEventData2 | sort count desc | rename payload.ExtEventData2 as AppPath | eval AppNameSplit = split(AppPath, "\\") | eval AppName = mvindex(AppNameSplit, -1) | table AppName|stats count by AppName</query> <earliest>$time_field.earliest$</earliest> <latest>$time_field.latest$</latest> <sampleRatio>1</sampleRatio> </search> <option name="dataOverlayMode">none</option> <option name="drilldown">none</option> <option name="percentagesRow">false</option> <option name="refresh.display">progressbar</option> <option name="rowNumbers">false</option> <option name="totalsRow">false</option> <option name="wrap">true</option> <format type="color" field="FunctionFailed"> <colorPalette type="list">[#118832,#D41F1F]</colorPalette> <scale type="threshold">1</scale> </format> </table> </panel> </row> <row> <panel> <table> <title>File Transfer - Top transfered in file count</title> <search> <query>index= sourcetype= source=type="Citrix.EventMonitor.FileTransfer" | spath payload.ExtEventData3 | search payload.ExtEventData3 = "Host:*" | rename payload.ExtEventData3 as filePath | eval fileSplit = split(filePath, "\\") | eval FileName = mvindex(fileSplit, -1) | table FileName | stats count by FileName | sort bv count desc</query> <earliest>$time_field.earliest$</earliest> <latest>$time_field.latest$</latest> <sampleRatio>1</sampleRatio> </search> <option name="dataOverlayMode">none</option> <option name="drilldown">none</option> <option name="percentagesRow">false</option> <option name="rowNumbers">false</option> <option name="totalsRow">false</option> <option name="wrap">true</option> <format type="color" field="FunctionFailed"> <colorPalette type="list">[#118832,#D41F1F]</colorPalette> <scale type="threshold">1</scale> </format> </table> </panel> <panel> <table> <title>File Transfer - Top transfered in file size by user</title> <search> <query>index= sourcetype= source=type="Citrix.EventMonitor.FileTransfer" | spath payload.ExtEventData3 | search payload.ExtEventData3 = "Host:*" | rename payload.ExtEventData4 as filesize | eval filesize_mb = case( like(filesize, "% B"), tonumber(replace(filesize, " B", "")) / 1024 /1024, like(filesize, "% KB"), tonumber(replace(filesize, " KB", "")) / 1024, like(filesize, "% MB"), tonumber(replace(filesize, " MB", "")), like(filesize, "% GB"), tonumber(replace(filesize, " GB", "")) * 1024, like(filesize, "% TB"), tonumber(replace(filesize, " TB", "")) * 1024 * 1024 ) | table payload.user, filesize_mb | stats sum by payload.user |rename sum(filesize_mb) as FileSize(MB), payload.user as User</query> <earliest>$time_field.earliest$</earliest> <latest>$time_field.latest$</latest> <sampleRatio>1</sampleRatio> </search> <option name="dataOverlayMode">none</option> <option name="drilldown">none</option> <option name="percentagesRow">false</option> <option name="refresh.display">progressbar</option> <option name="rowNumbers">false</option> <option name="totalsRow">false</option> <option name="wrap">true</option> <format type="color" field="FunctionFailed"> <colorPalette type="list">[#118832,#D41F1F]</colorPalette> <scale type="threshold">1</scale> </format> </table> </panel> <panel> <table> <title>File Transfer - Top transfered out file count by user</title> <search> <query>index= sourcetype= source=type="Citrix.EventMonitor.FileTransfer" | spath payload.ExtEventData2 | search payload.ExtEventData2 = "Host:*" | table payload.user, payload.ExtEventData2 | stats count by payload.user | rename payload.user as User</query> <earliest>$time_field.earliest$</earliest> <latest>$time_field.latest$</latest> <sampleRatio>1</sampleRatio> </search> <option name="dataOverlayMode">none</option> <option name="drilldown">none</option> <option name="percentagesRow">false</option> <option name="rowNumbers">false</option> <option name="totalsRow">false</option> <option name="wrap">true</option> <format type="color" field="FunctionFailed"> <colorPalette type="list">[#118832,#D41F1F]</colorPalette> <scale type="threshold">1</scale> </format> </table> </panel> </row> </form> <!--NeedCopy-->