This content has been machine translated dynamically.
Dieser Inhalt ist eine maschinelle Übersetzung, die dynamisch erstellt wurde. (Haftungsausschluss)
Cet article a été traduit automatiquement de manière dynamique. (Clause de non responsabilité)
Este artículo lo ha traducido una máquina de forma dinámica. (Aviso legal)
此内容已经过机器动态翻译。 放弃
このコンテンツは動的に機械翻訳されています。免責事項
이 콘텐츠는 동적으로 기계 번역되었습니다. 책임 부인
Este texto foi traduzido automaticamente. (Aviso legal)
Questo contenuto è stato tradotto dinamicamente con traduzione automatica.(Esclusione di responsabilità))
This article has been machine translated.
Dieser Artikel wurde maschinell übersetzt. (Haftungsausschluss)
Ce article a été traduit automatiquement. (Clause de non responsabilité)
Este artículo ha sido traducido automáticamente. (Aviso legal)
この記事は機械翻訳されています.免責事項
이 기사는 기계 번역되었습니다.책임 부인
Este artigo foi traduzido automaticamente.(Aviso legal)
这篇文章已经过机器翻译.放弃
Questo articolo è stato tradotto automaticamente.(Esclusione di responsabilità))
Translation failed!
Windows Services Health Check with uberAgent
This guide provides step-by-step instructions to set up Windows service monitoring with uberAgent. It covers both the fast-to-deploy ESA approach and the customizable UXM scripting method.
Option 1: Native ESA Monitoring - Fast to Deploy
uberAgent ESA monitors Windows services via Event Logs. It tracks service stop events and visualizes results in Splunk.
Here’s what you need to do:
- In
uberAgent.conf, verify that ESA is enabled.
[ProductComponents]
EnableESA = true
<!--NeedCopy-->
- In
uberAgent-ESA.conf, add the following configuration to enable Windows services monitoring:@configinclude uberAgent-ESA-eventlog.conf - In
uberAgent-ESA-eventlog-windows.conf, specify which services to monitor. The example below monitors theWindows Module InstallerandOptimize drivesservices every minute. You can adjust the services and intervals as needed. Alternatively, you could also monitor on demand, but this uses more resources (details).
[Timer]
Name = Eventlog
EventLog=TimerBased-Service-Events
Interval=60s

[EventLog Name=TimerBased-Service-Events]
EventLog = System
Provider=Service Control Manager
EventFilterXPath=*[EventData[Data[@Name="param2"]="stopped"]  and (EventData[Data[@Name="param1"]="Windows Modules Installer"] or EventData[Data[@Name="param1"]="Optimize drives"])]
EventID=7036
<!--NeedCopy-->
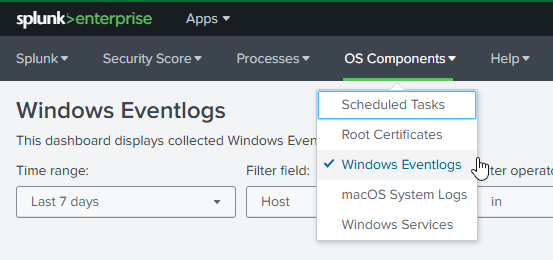
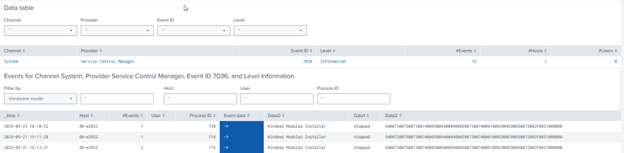
- Use uberAgent ESA’s Windows Eventlogs dashboard to visualize the collected data. The dashboard can be found in the Splunk app uberAgent ESA OS Components -> Windows Eventlogs.
Option 2: Custom script - tailored to your needs (PowerShell)
uberAgent UXM allows you to run custom scripts at set intervals for maximum flexibility.
- Save the following as
C:\stopped_services.ps1or whatever name and location you prefer.
# Get all stopped services
$stopped_services = (Get-Service | Where-Object {$_.Status -eq 'Stopped'}) -join ','
# Get select stopped services
# $stopped_services = Get-Service -Name service1,service2 | Where-Object {$_.Status -eq 'Stopped'}
[Hashtable]$Output = @{
    'stopped_services'="$stopped_services"
}
Write-Output $($Output.Keys.ForEach({"$_=$($Output.$_)"}) -join ' ')
<!--NeedCopy-->
Note: the above script collects all stopped services. If you want to monitor specific services, you can modify the script to filter for those services by name.
- In the
uberAgent.conf, add a new timer to run the script every 5 minutes. Time timer will execute the PowerShell script in the context of the system session.
[Timer]
Name = ServiceHealthCheck
Interval = 300000
Script = powershell.exe -executionpolicy bypass -file C:\stopped_services.ps1
ScriptContext = Session0AsSystem
<!--NeedCopy-->
Splunk Integration and Alerting
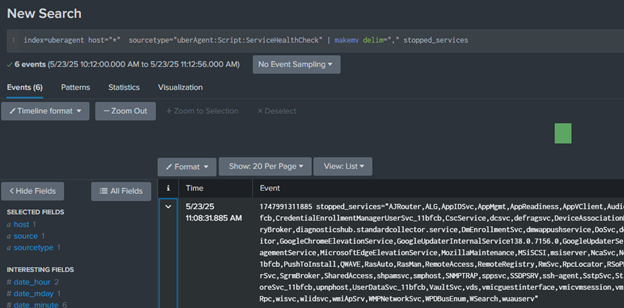
Connect Splunk alerts to ServiceNow to automatically create incidents when critical services fail. The following search query retrieves stopped services and formats them for easier analysis.
index=uberagent sourcetype="uberAgent:Script:ServiceHealthCheck"
| makemv delim="," stopped_services
<!--NeedCopy-->
To set up alerts for stopped services, you can create a Splunk alert based on the search queries above.
If your organization uses ServiceNow, please note that it is possible to configure Splunk alerts to automatically create incident tickets in ServiceNow and, these tickets can be routed to specific teams or individuals based on custom logic, such as the service affected, the host involved, or alert severity. This integration is managed entirely within Splunk using the ServiceNow Integration App or custom alert actions (webhooks or REST API calls), and no configuration changes are required on the uberAgent side.
Next Steps
- Start with uberAgent ESA for quick wins.
- Use uberAgent’s custom script engine for custom service checks.
- Explore the full uberAgent documentation for advanced configurations.
Share
Share
This Preview product documentation is Citrix Confidential.
You agree to hold this documentation confidential pursuant to the terms of your Citrix Beta/Tech Preview Agreement.
The development, release and timing of any features or functionality described in the Preview documentation remains at our sole discretion and are subject to change without notice or consultation.
The documentation is for informational purposes only and is not a commitment, promise or legal obligation to deliver any material, code or functionality and should not be relied upon in making Citrix product purchase decisions.
If you do not agree, select I DO NOT AGREE to exit.