Analyze logon performance using Citrix Environment Tool Hub
Citrix Environment Tool Hub provides detailed logon phase analysis, process monitoring, and deep performance metrics to help you identify and resolve logon delays efficiently.
This article builds on the concepts described in Troubleshoot Login Time Issues Using Citrix Environment Tool Hub and WEM and introduces the Tool Hub’s enhanced diagnostic features through a complete, step-by-step diagnostic workflow.
About enhanced diagnostic capabilities
Citrix Environment Tool Hub introduces several enhancements that make logon performance analysis more comprehensive and actionable:
- Optimized report presentation
- Enhanced Process Monitor integration
- Deep metrics from Process Monitor log integration
Optimized report presentation
The Windows Logon Analysis tool now provides an improved, tabular report view that presents logon analysis results in a clear and structured format:
- Logon analysis results appear in a table.
- Each record includes fields such as Logon time, Duration, Username, Session ID, and Machine name.
- Clicking a record opens a detailed view that breaks down each logon phase (for example, Group Policy, Shell, and Profile).
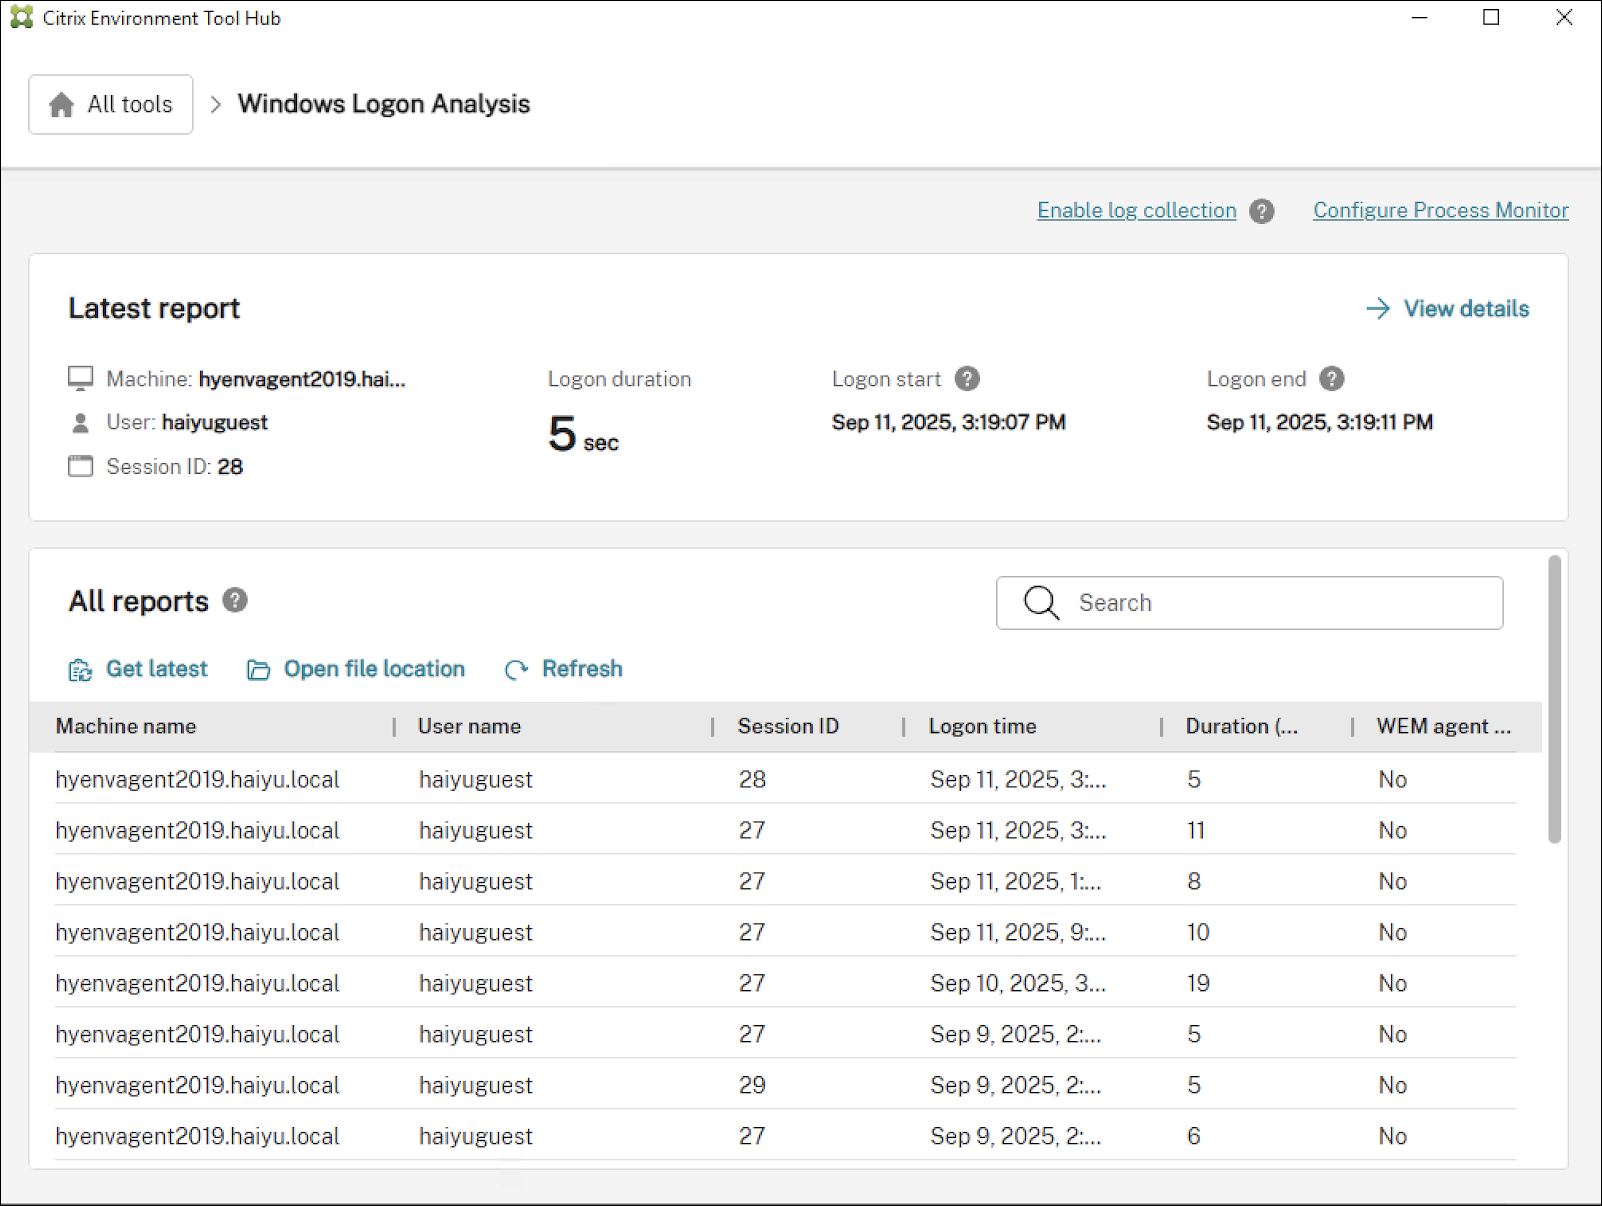
This layout helps you identify the slowest logon phases quickly and focus your investigation on potential bottlenecks.
Enhanced Process Monitor integration
The Process Monitor module now provides granular insights into process behavior during logon, including:
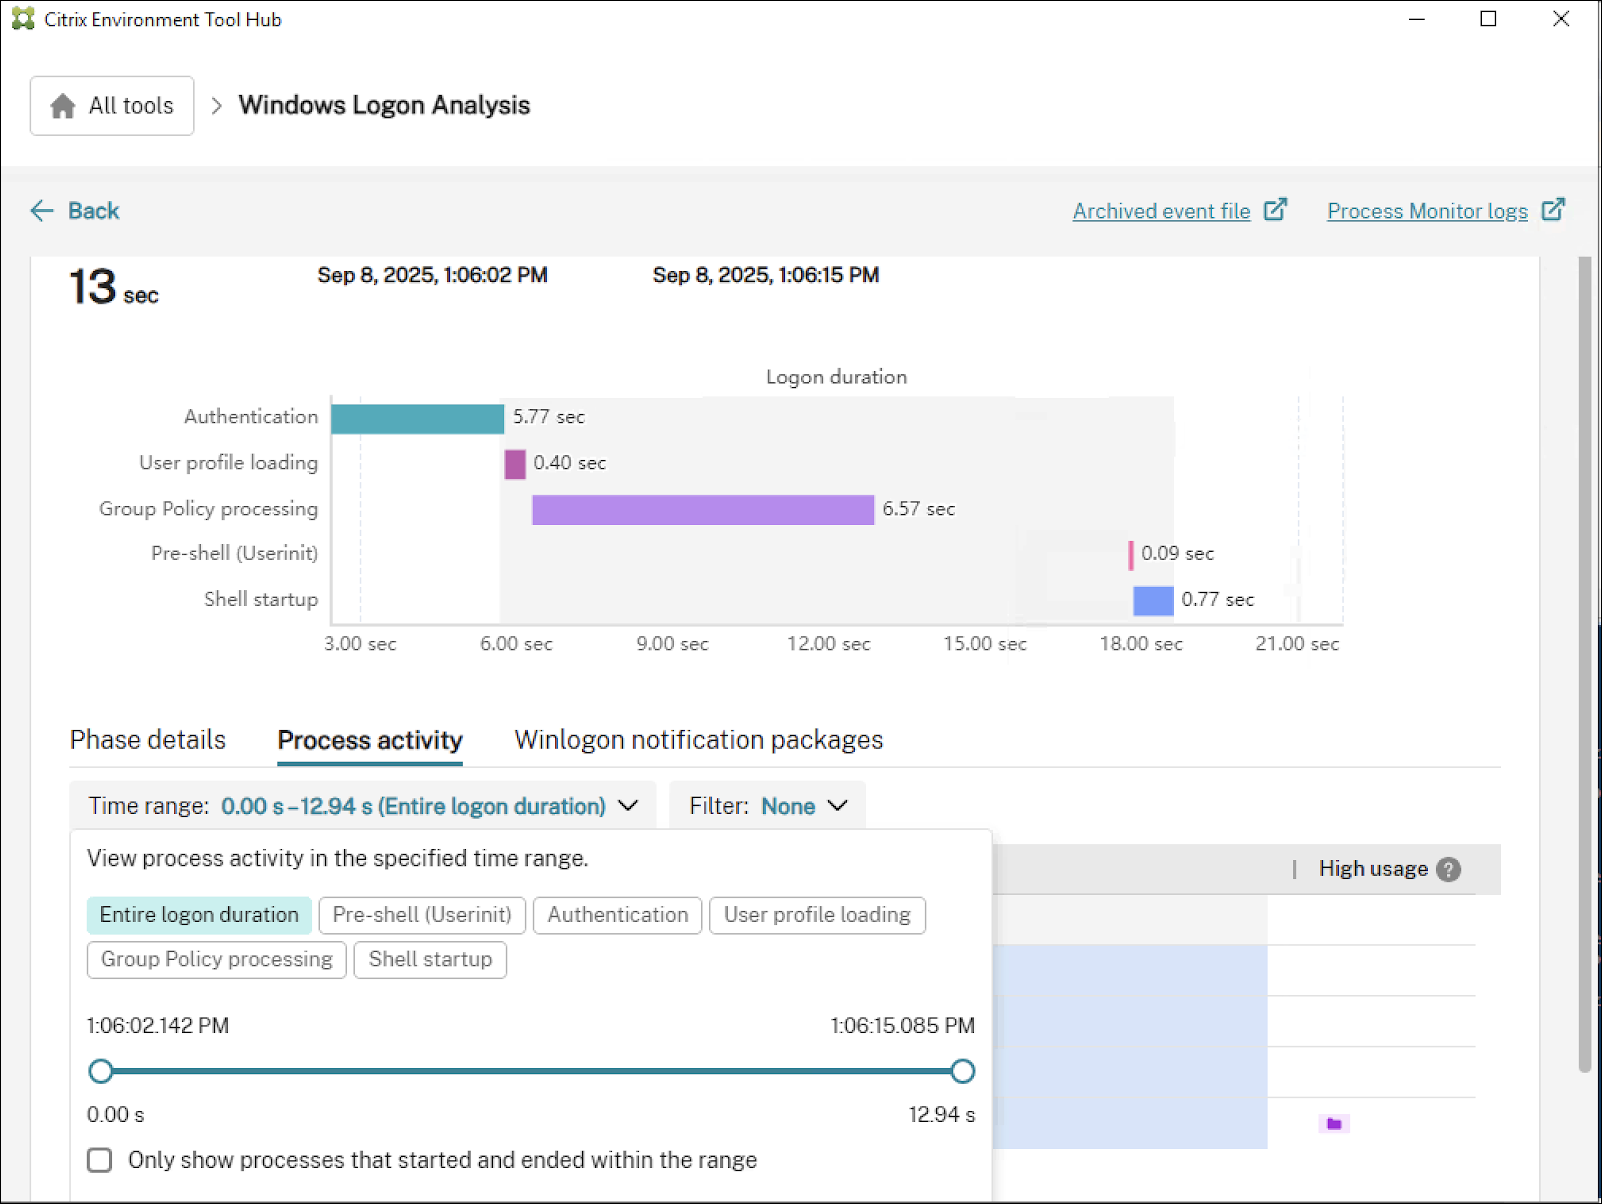
Time range and resource filtering
With this feature, you can:
- Drag to select a time range on the logon timeline.
- Use predefined phase filters such as Authentication or Shell startup.
-
Optionally enable Show only processes that start and end within the selected time range.
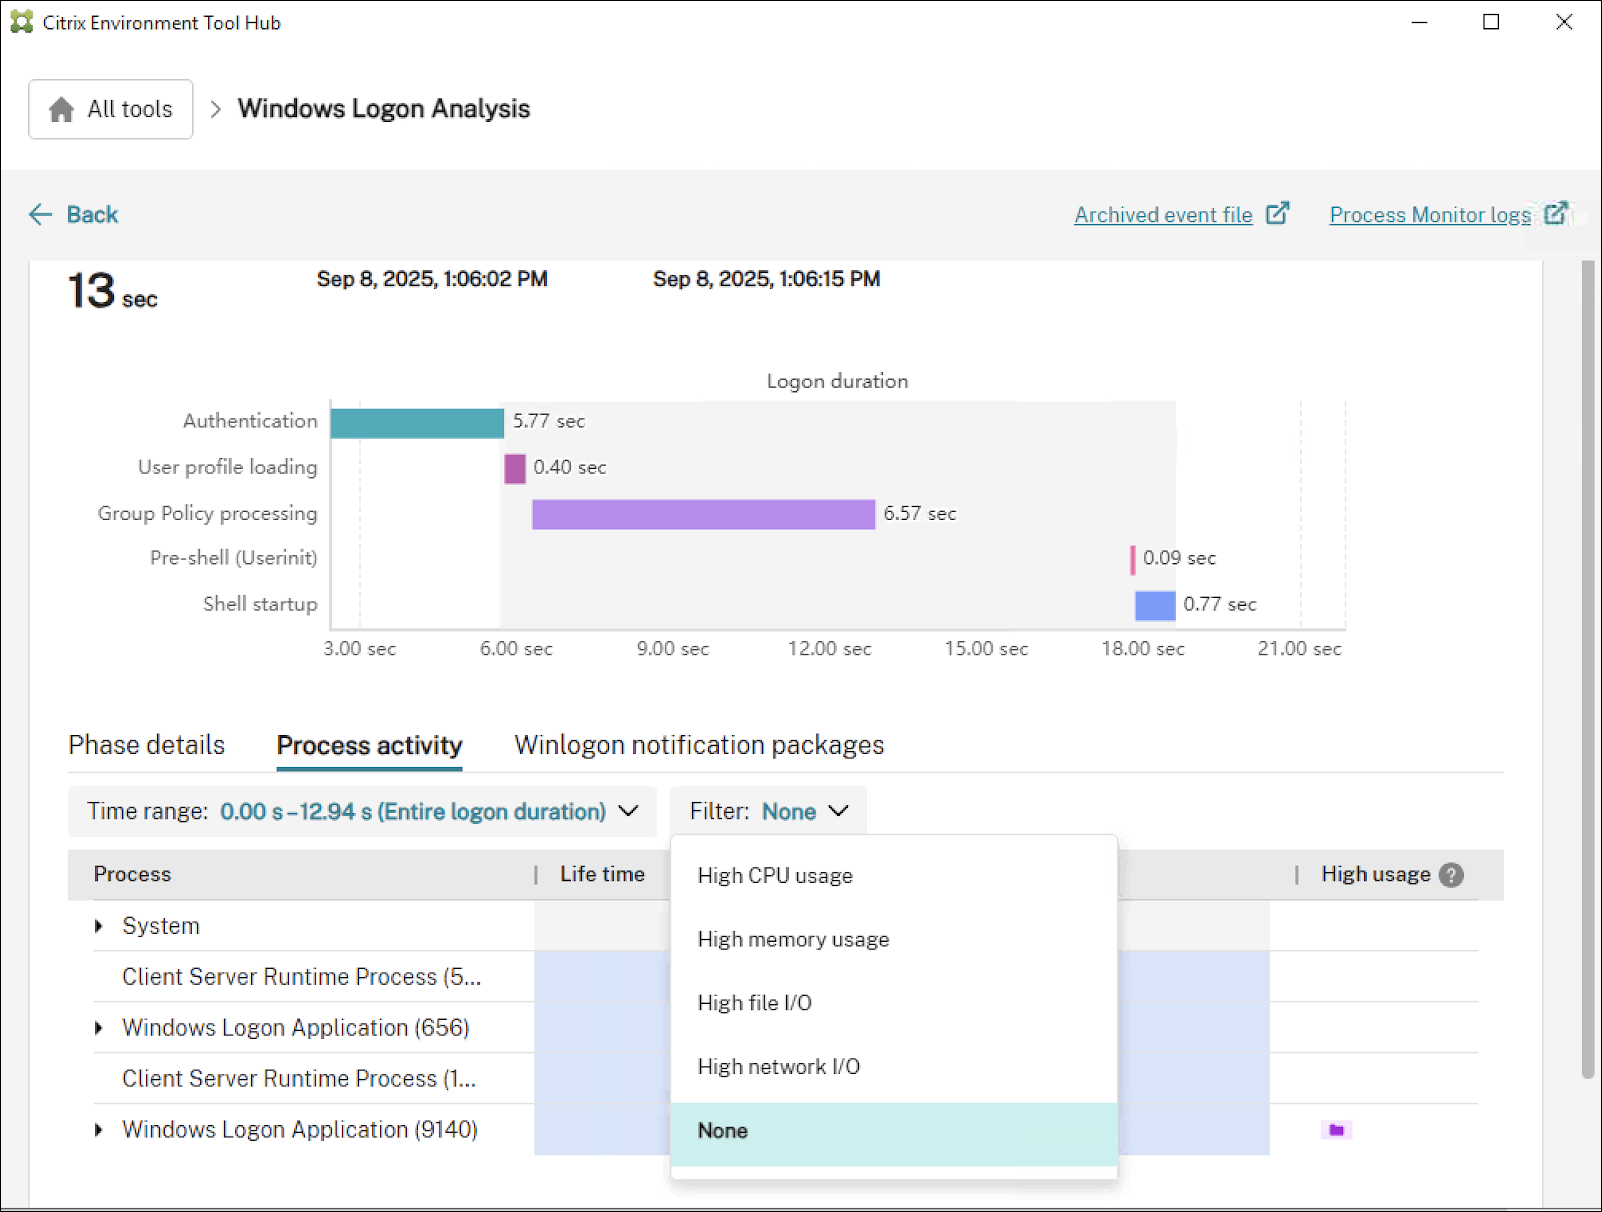
- Apply resource filters to identify:
- High CPU usage
- High memory usage
- High file I/O
- High network I/O
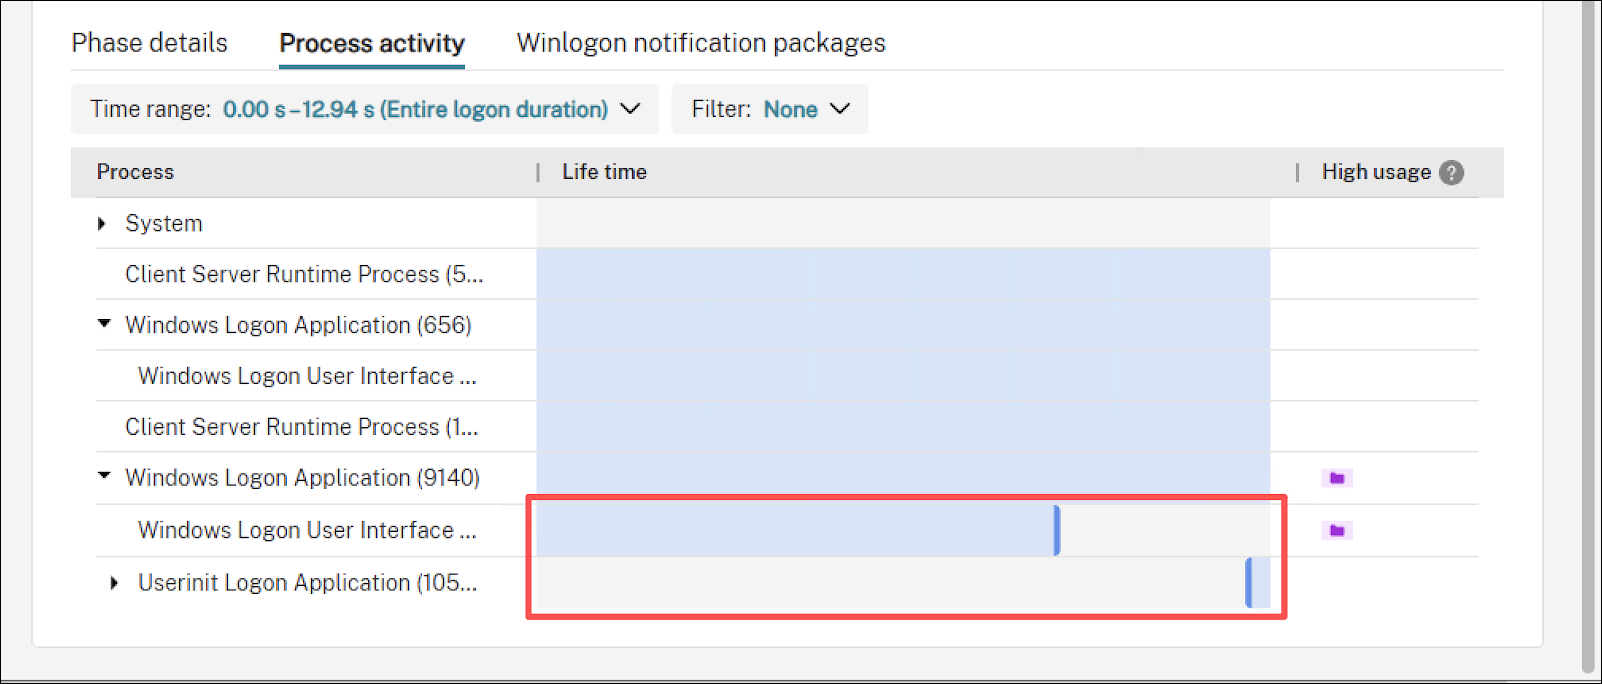
Lifecycle visualization and usage markers
Detailed features include:
- Each process appears as a horizontal lifecycle bar.
- High resource usage is marked with visual indicators.
- Start and end points are highlighted for easy identification.
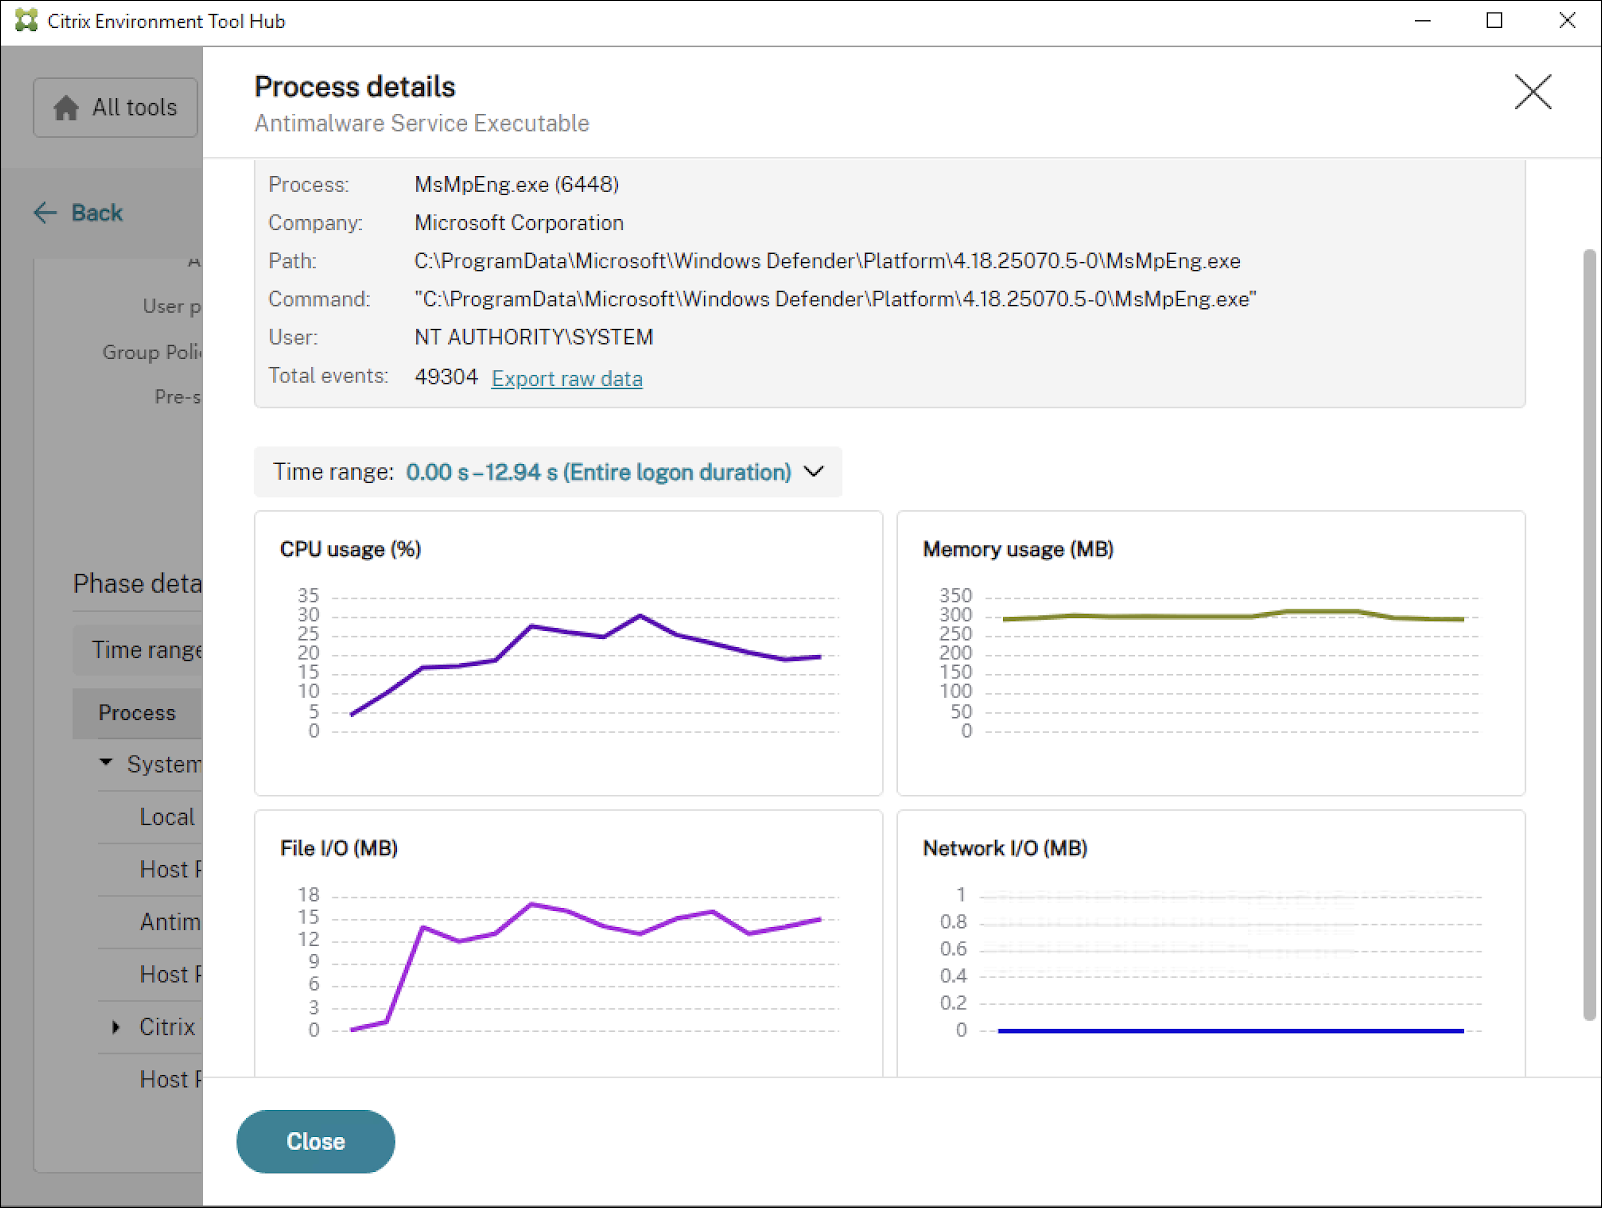
Linked detail view
Detailed features include:
- Selecting a lifecycle bar opens a detailed process view.
- The detail view includes process metadata such as Name, PID, Start time, User, and Command line.
- Four resource usage charts are available:
- CPU usage (%)
- Memory usage (MB)
- File I/O activity (MB)
- Network usage (MB)
- The Export raw data option lets you download event-level details, such as thread activity, module loads, or system calls, for advanced analysis or archiving.
Deep metrics from Process Monitor log integration
When you enable Process Monitor logging during logon analysis, the Windows Logon Analysis tool automatically parses the log and adds detailed performance metrics to your report.
Examples include:
-
Temporary folder traversal time: If a user’s
%TEMP%directory includes many files or nested folders, logon delays can occur during folder access. -
Default profile copy time: During a first-time logon, the system copies the default profile from
C:\Users\Defaultto the user directory, which can significantly extend logon duration.
Other metrics might appear depending on your environment and captured activity.
Case study: Diagnose a slow logon
A user reported slow logon performance. The following example demonstrates how an administrator diagnosed and resolved the issue using Citrix Environment Tool Hub.
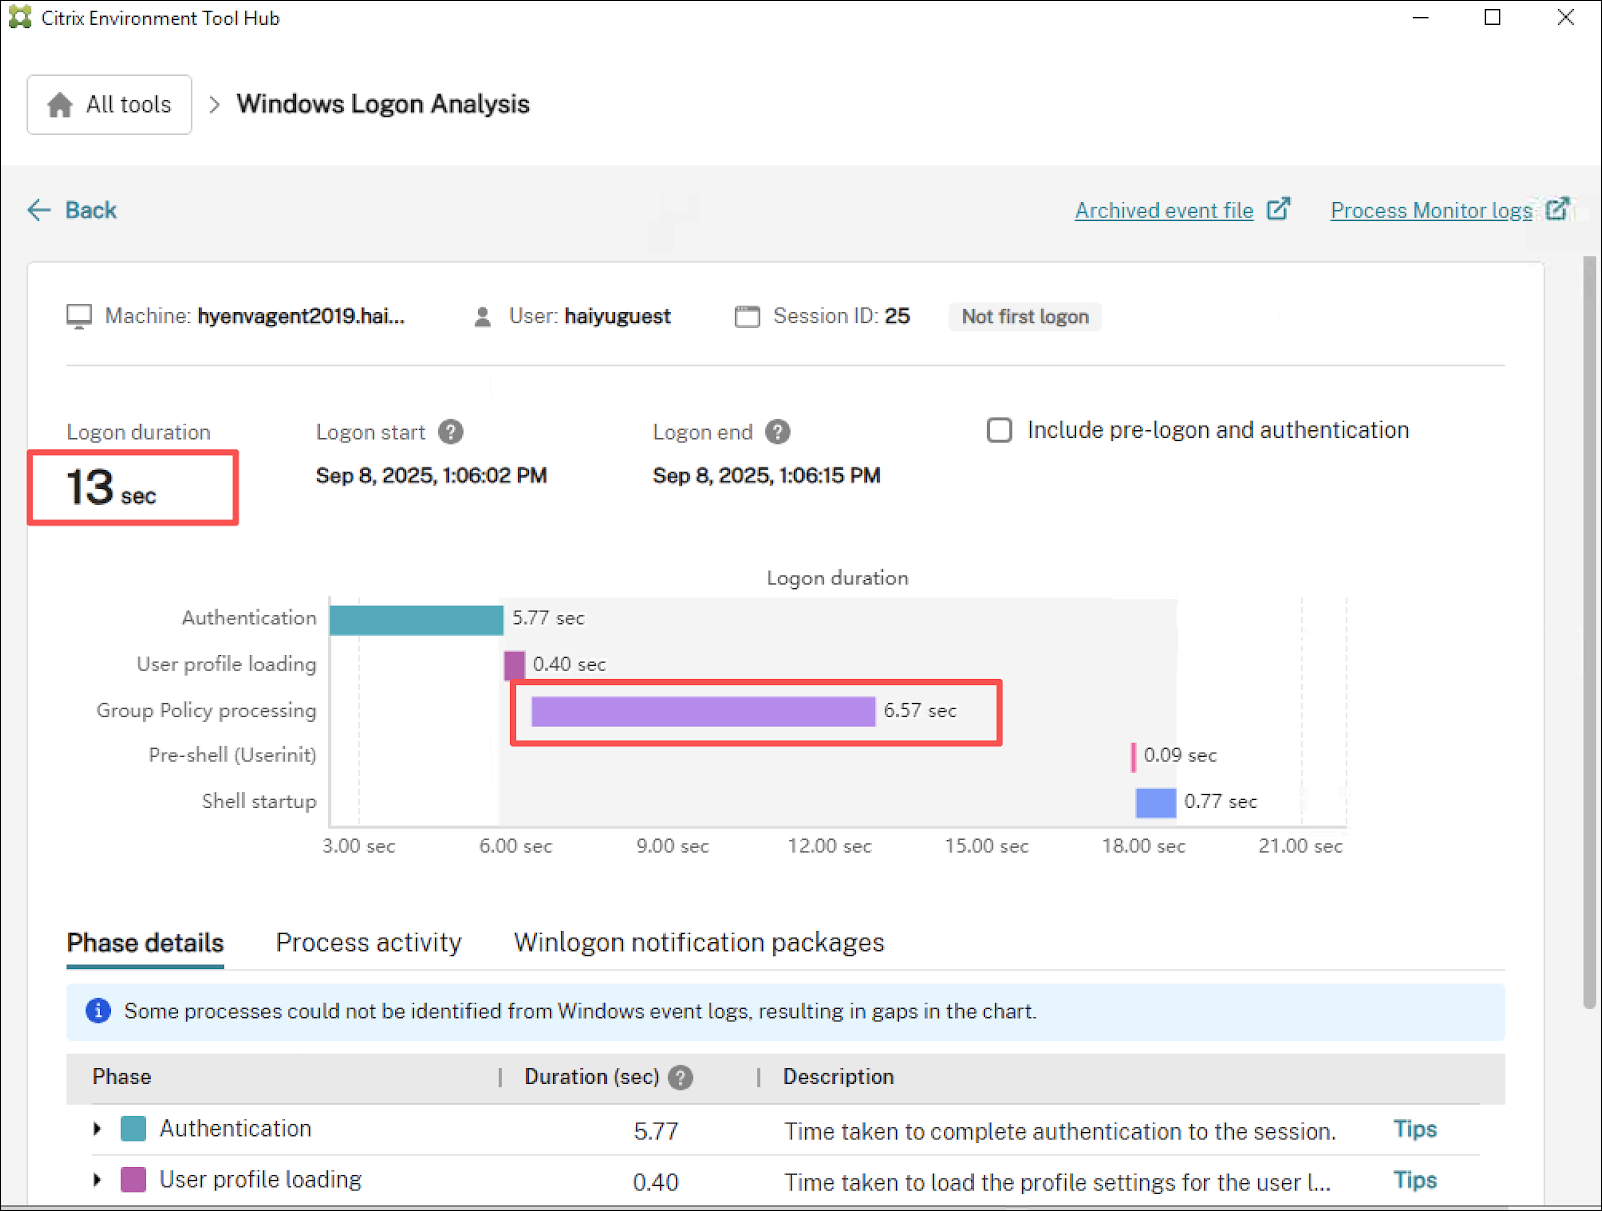
Step 1: Analyze the initial logon
- Open Citrix Environment Tool Hub.
-
Run a logon analysis and review the results.
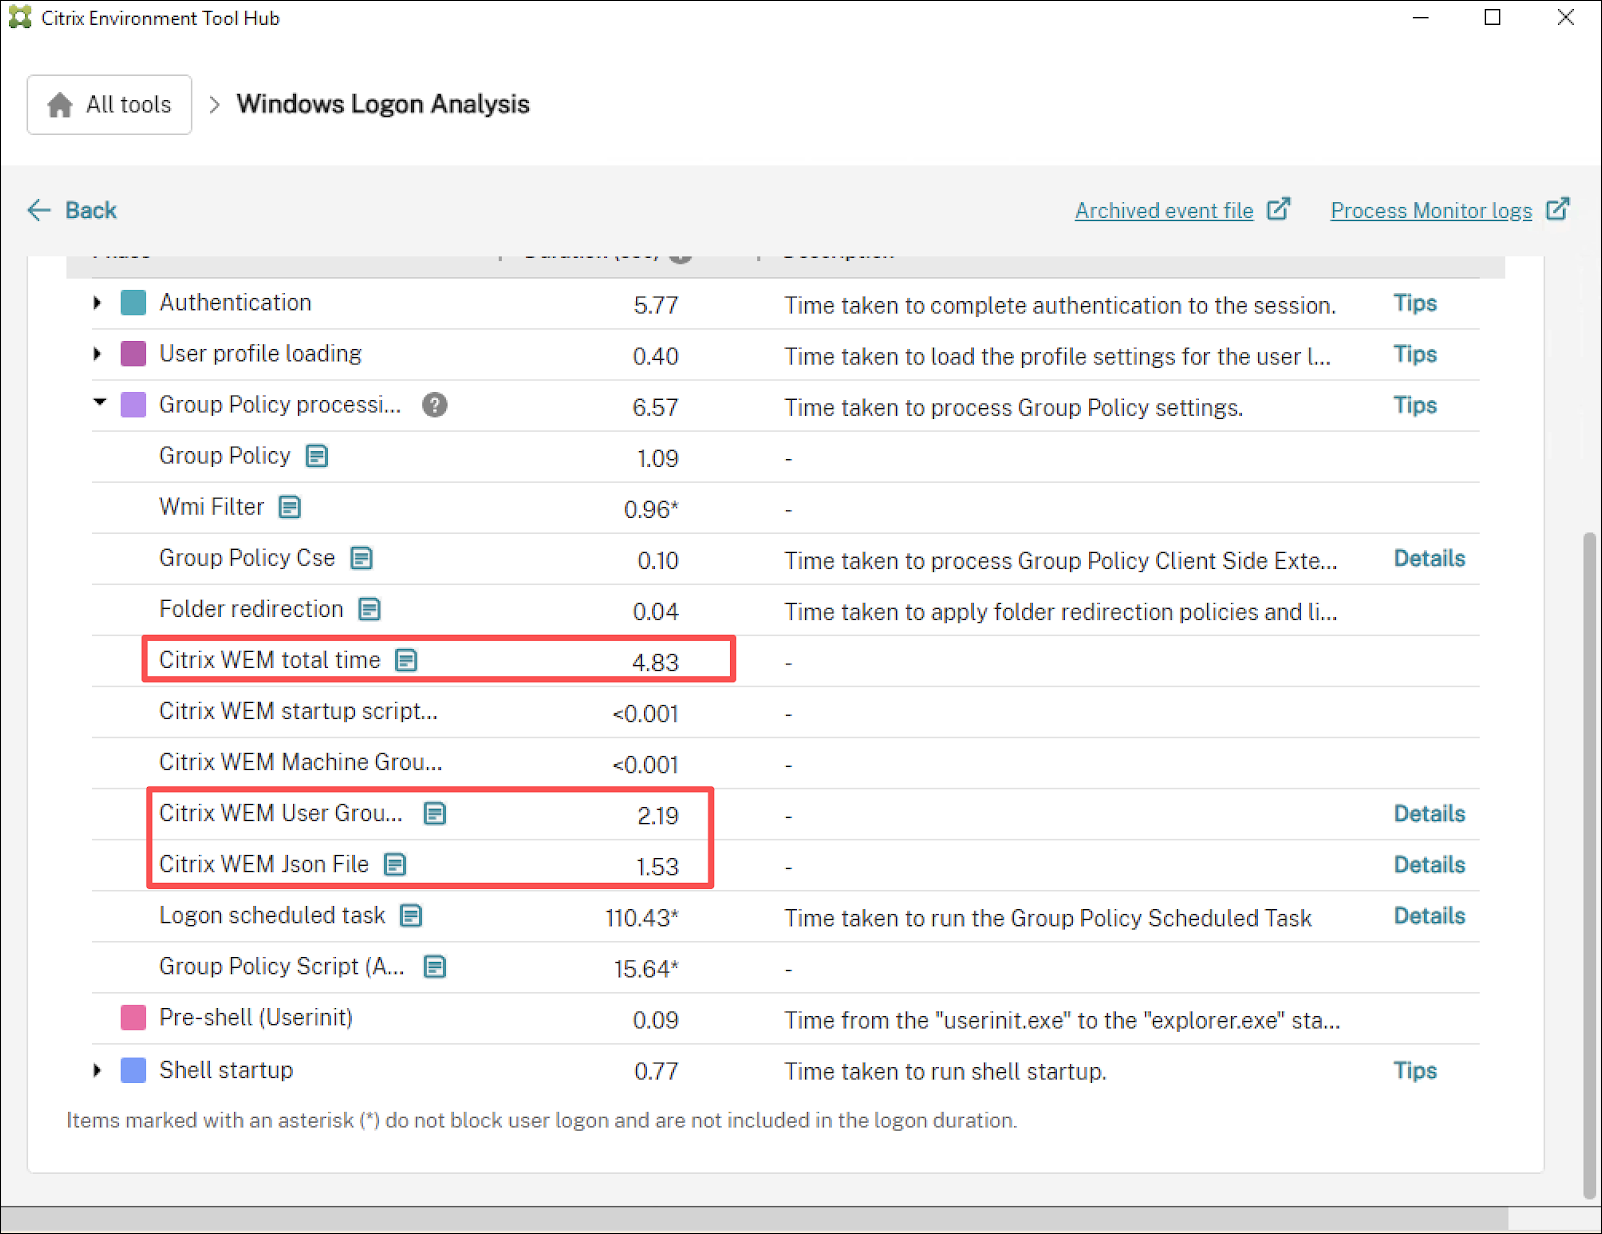
Initial findings:
- Total logon duration: 13 seconds
- Group Policy processing: 6.57 seconds (about half of the total duration)
This initial analysis suggests Group Policy is the primary bottleneck. Continue the investigation using Process Monitor.
Step 2: Enable Process Monitor and reproduce the issue
- Enable Process Monitor in the Windows Logon Analysis tool. For more information, see Process activity and details.
- Ask the user to log on again to capture a complete trace.
- After the logon completes, run another logon analysis.
- Open the Process activity tab to view process behavior during the logon.
-
Select the Group Policy phase time range and apply high-usage filters to pinpoint resource-intensive processes.
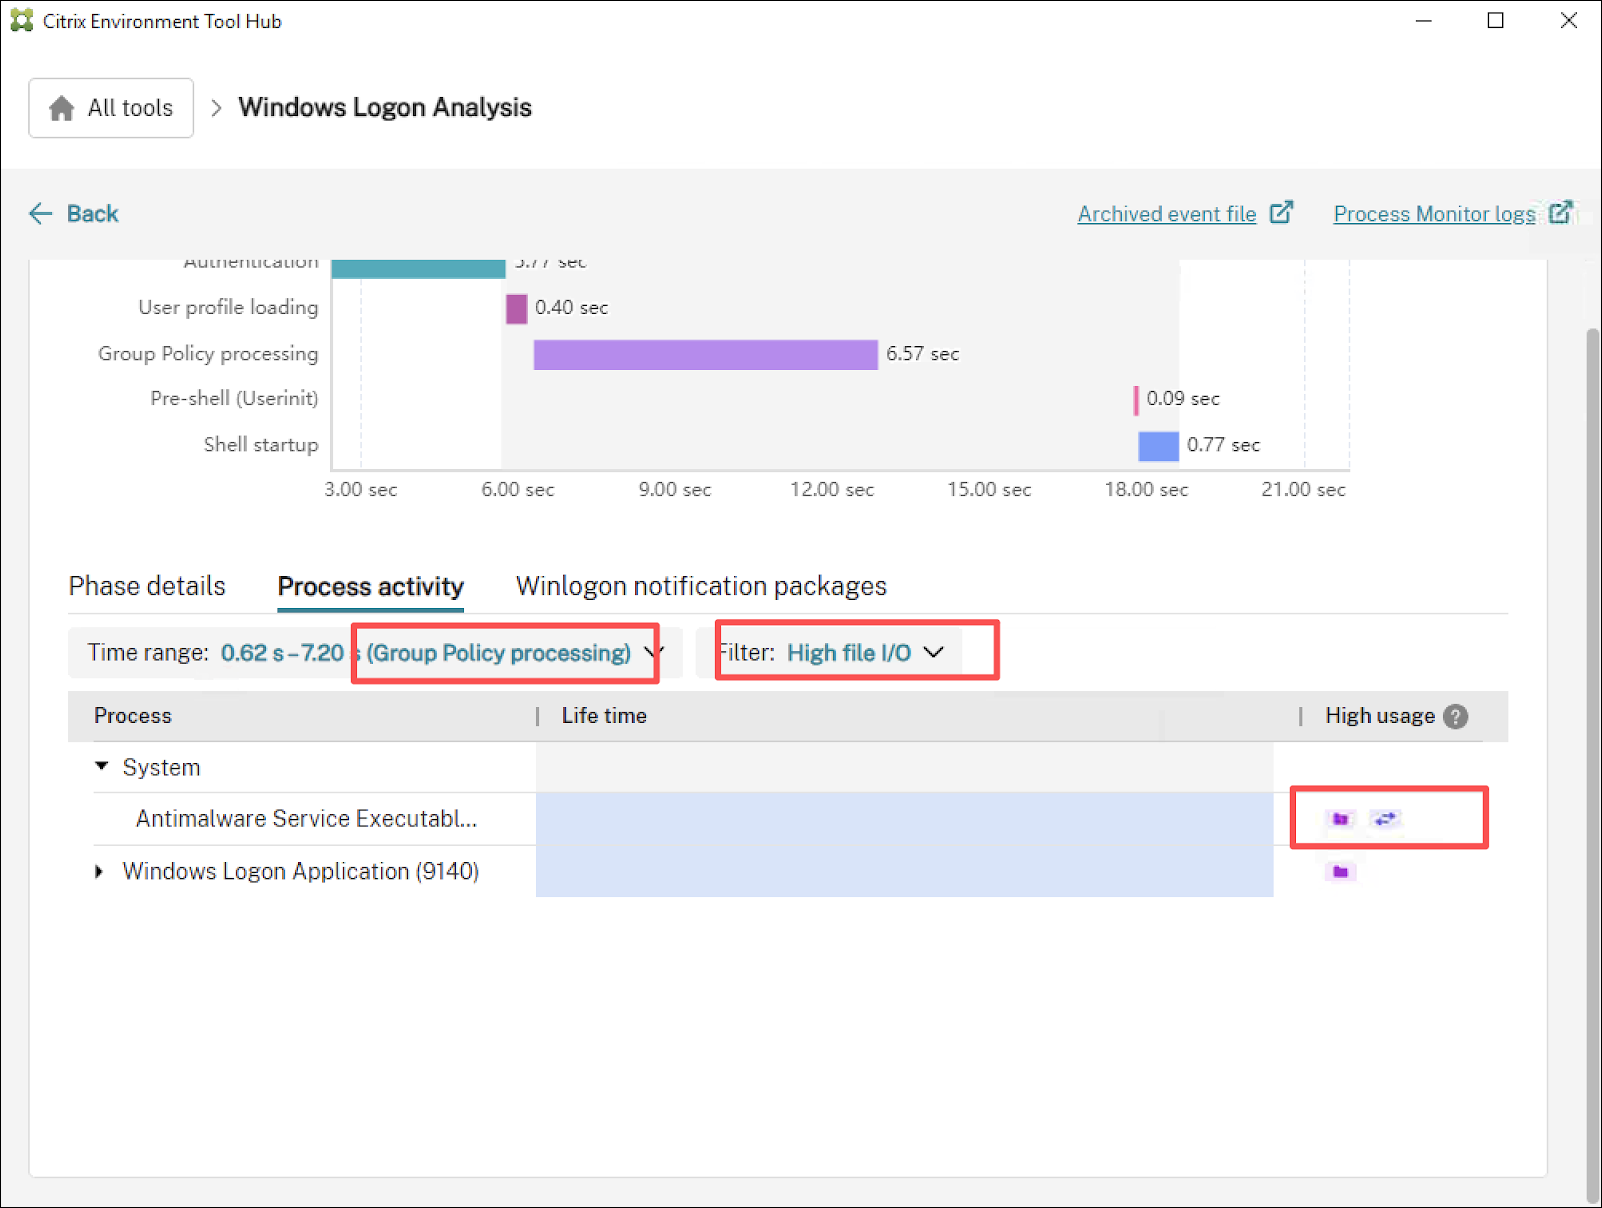
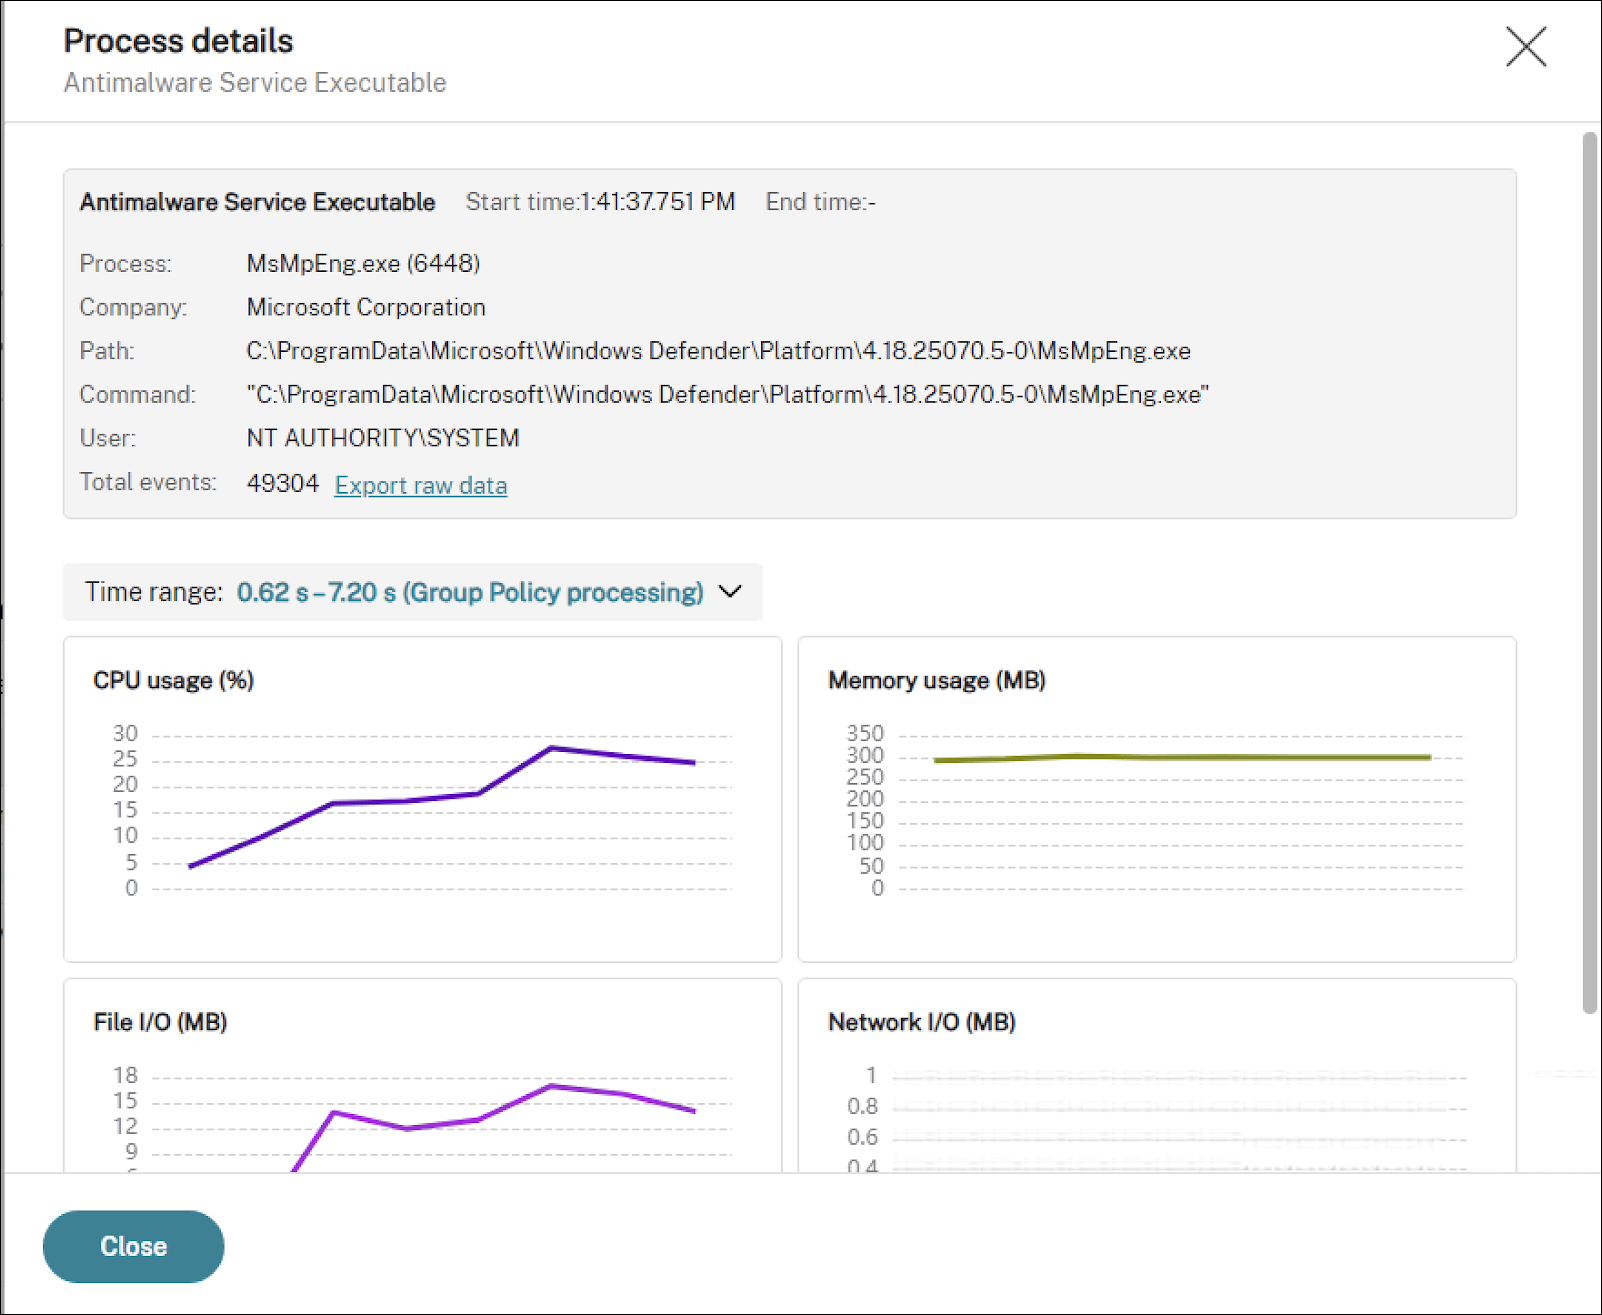
Step 3: Identify the high-usage process
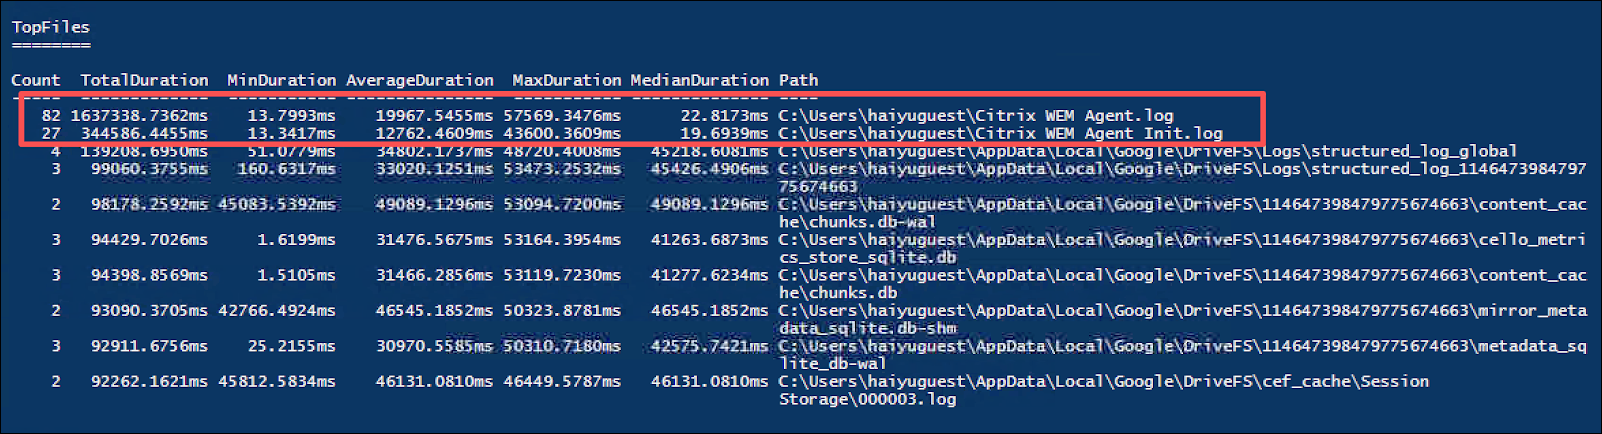
- Among the highlighted processes, MsMpEng.exe (Microsoft Defender’s Antimalware Service Executable) showed sustained file I/O activity during the Group Policy phase.
-
Open the Process details view to confirm Defender’s real-time file scanning during policy execution.
Step 4: Confirm the root cause and apply a fix
- Review the detailed log to identify which WEM agent tasks triggered Defender scans. Examples include:
- Citrix WEM User Group Policy (2.19 seconds)
-
Citrix WEM JsonFile processing (1.53 seconds)
- Start performance monitoring to confirm Defender scan impact:
- Run
New-MpPerformanceRecordingto start monitoring. - Ask the user to log on again.
- Run
Get-MpPerformanceReportto summarize Defender’s scan impact.
For more information, see the following Microsoft articles about New-MpPerformanceRecording and Get-MpPerformanceReport.
- Run
- Verify that the WEM agent is a trusted Citrix component.
- Add exclusions in Microsoft Defender for the WEM agent’s processes and file paths.
- After applying the exclusions, ask the user to log on again.
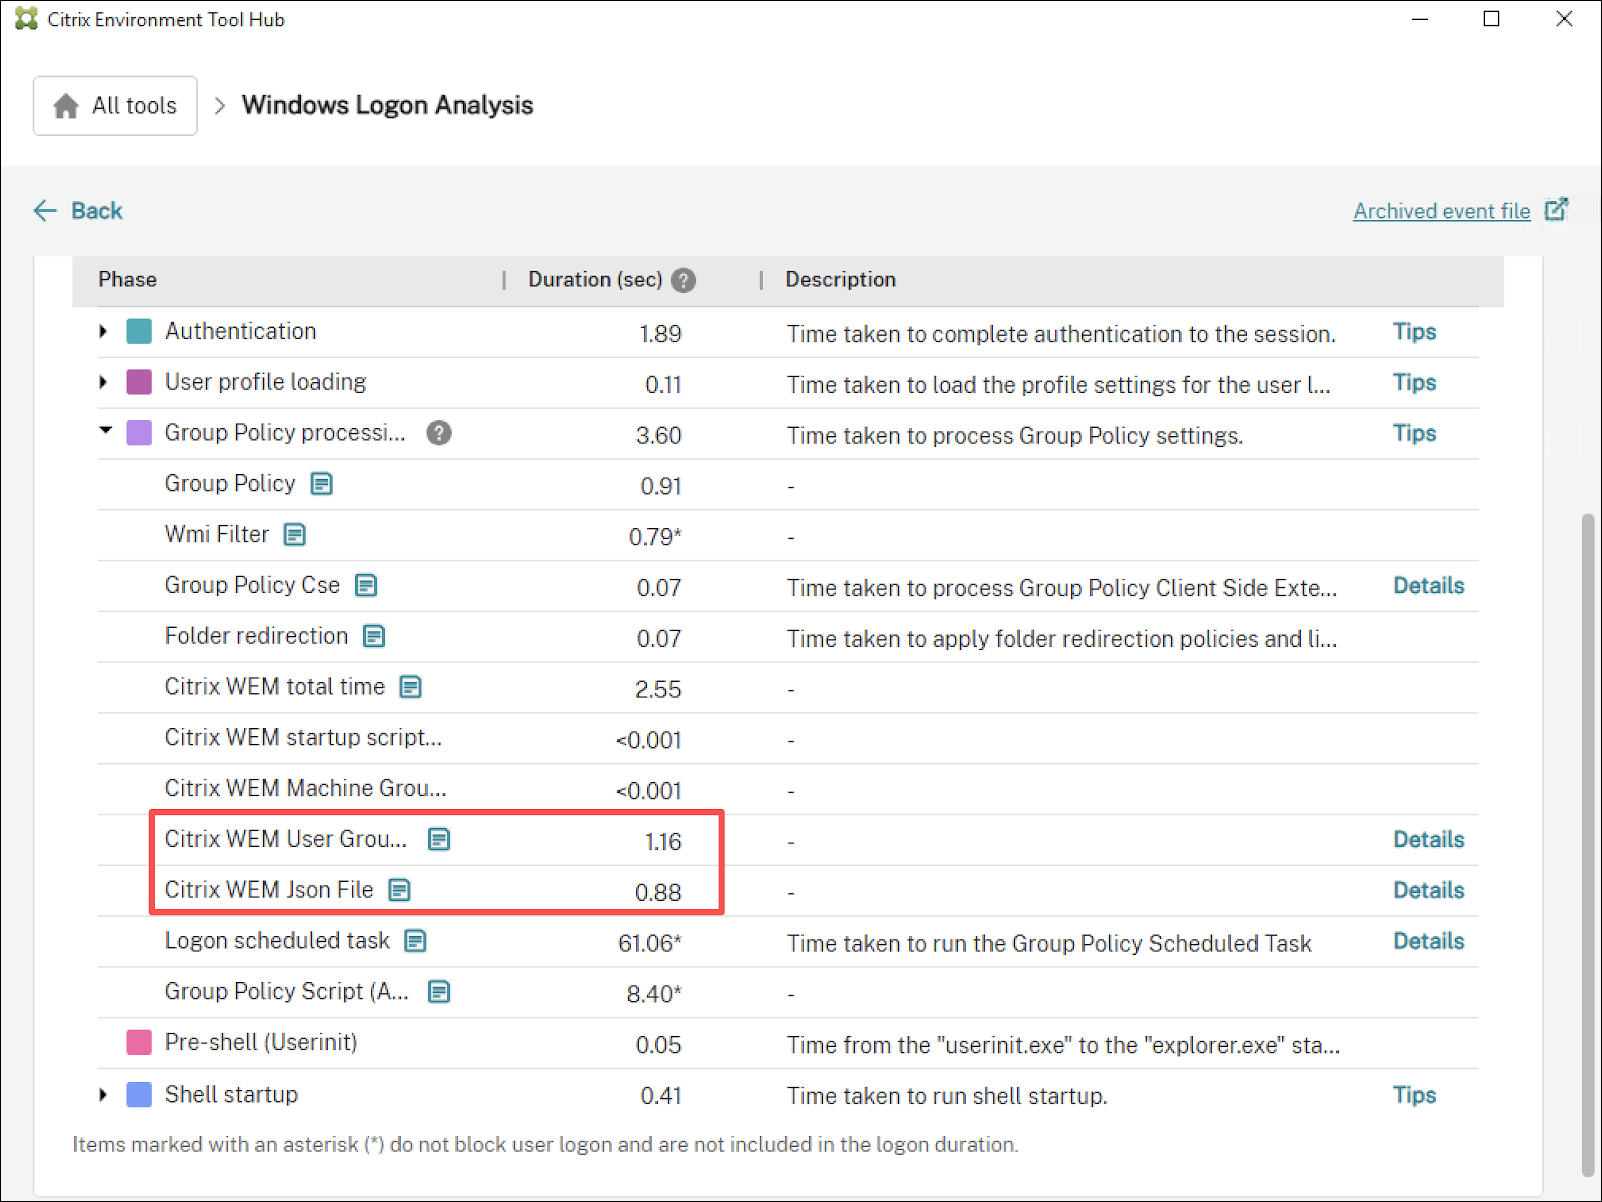
-
Verify that the Group Policy duration decreases and that overall logon performance improves.
Summary
This example illustrates a complete diagnostic workflow: from user report to analysis, trace capture, root cause identification, and resolution.
The integration of Process Monitor with Citrix Environment Tool Hub helps you uncover hidden bottlenecks and apply targeted optimizations to improve user experience across your Citrix environment.