Agent Insights
Agent Insights is a tool provided with the WEM service agent that helps you monitor and troubleshoot session performance, user profile usage, and logon activity in real time.
Note:
Agent Insights is available only for WEM service agent versions 2511 and later.
With Agent Insights, you can review the following details on your machine:
- Session: The current session status and session quality over the last five minutes.
- Profile: User profile details, including profile type, profile size, a list of large files, and (for profile containers) capacity.
- Logon: Logon duration, start and end times, and key logon metrics.
WEM Administrators: Enable and configure Agent Insights in the WEM console
If the agent runs in a mode other than Basic mode, enable and configure Agent Insights for your machines using the WEM web console. To do so:
-
In the WEM web console, open your configuration set in Configuration sets.
-
Go to Advanced settings > UI agent personalization > User interaction, and select Show Agent Insights in agent menu.
For more information, see Advanced settings.
-
To ensure that logon data is displayed correctly, go to Advanced settings > Monitoring preferences > Additional settings, and select Save reports locally to display in Agent Insights.
For more information, see Additional settings.
If the agent runs in Basic mode, use Group Policy to enable this Agent Insights setting: enableAgentInsightsManagement.
For more information, see Manage Basic Deployment Agents.
Users: Enable and open Agent Insights on machines
After WEM administrators enable and configure Agent Insights in the WEM web console, as end users, you can access the feature from your machines.
Enable and open the Agent Insights panel to view detailed session performance, profile container usage, and logon activity. To do so:
-
Run the agent in UI mode.
For more information, see Agent in CMD and UI mode.
-
Right-click the agent icon in the notification area, and select Enable Agent Insights.
To disable Agent Insights, right-click the icon again and select Disable Agent Insights.
-
Click the agent icon in the notification area. The Agent Insights panel opens.
-
Use the tabs on the left side of the panel to view insights into:
Reference
The following tabs in the Agent Insights panel provide detailed metrics to help troubleshoot session performance, user profile usage, and logon activity:
Session tab
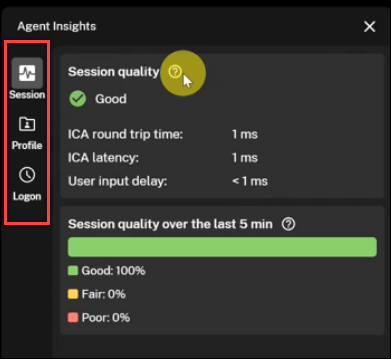
The Session tab provides insight into the current session status and session quality over the last five minutes.
Note:
This tab displays data only for Citrix virtual desktops. It doesn’t apply to physical machines.
Current session status
| Metric | Description |
|---|---|
| ICA® Round Trip Time | The time between a user action and the graphical response. Includes ICA latency, endpoint delay, and host delay. |
| ICA Latency | Measures network latency. |
| User Input Delay | The time that user input (such as mouse clicks or keystrokes) waits before being processed. High values might indicate resource contention or performance issues. |
Session quality
The Session Quality section summarizes the user experience over the last five minutes.
| Quality | Description |
|---|---|
| Good | The session is responsive. |
| Fair | Some performance degradation is present. |
| Poor | High latency or delays, likely due to network or system issues. |
Profile tab
The Profile tab displays:
- Profile type
- Profile size
- Capacity (for profile containers only)
- List of large files
Note:
Profile data is updated when Agent Insights loads. Select Refresh to rescan.
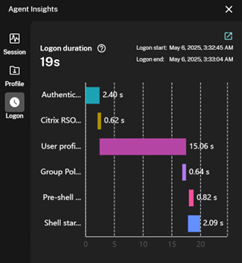
Logon tab
The Logon tab shows the following metrics:
| Metric | Description |
|---|---|
| Logon Duration | Total time required for the logon process. |
| Start and End Time | Time stamps for logon start and end. |
| Basic Metrics | Key indicators of logon performance. |
A waiting page appears before the logon data loads. After the user logs on, the summary appears.
Tip:
If Citrix Environment Tool Hub is installed, select the data area or the icon in the top-right corner of the panel to view more details. If it isn’t installed, a download link appears in the same location. Install Citrix Environment Tool Hub to access extended diagnostics and monitoring features.