Site Analytics
The Monitor dashboard provides a centralized location to monitor the health and usage of a site.
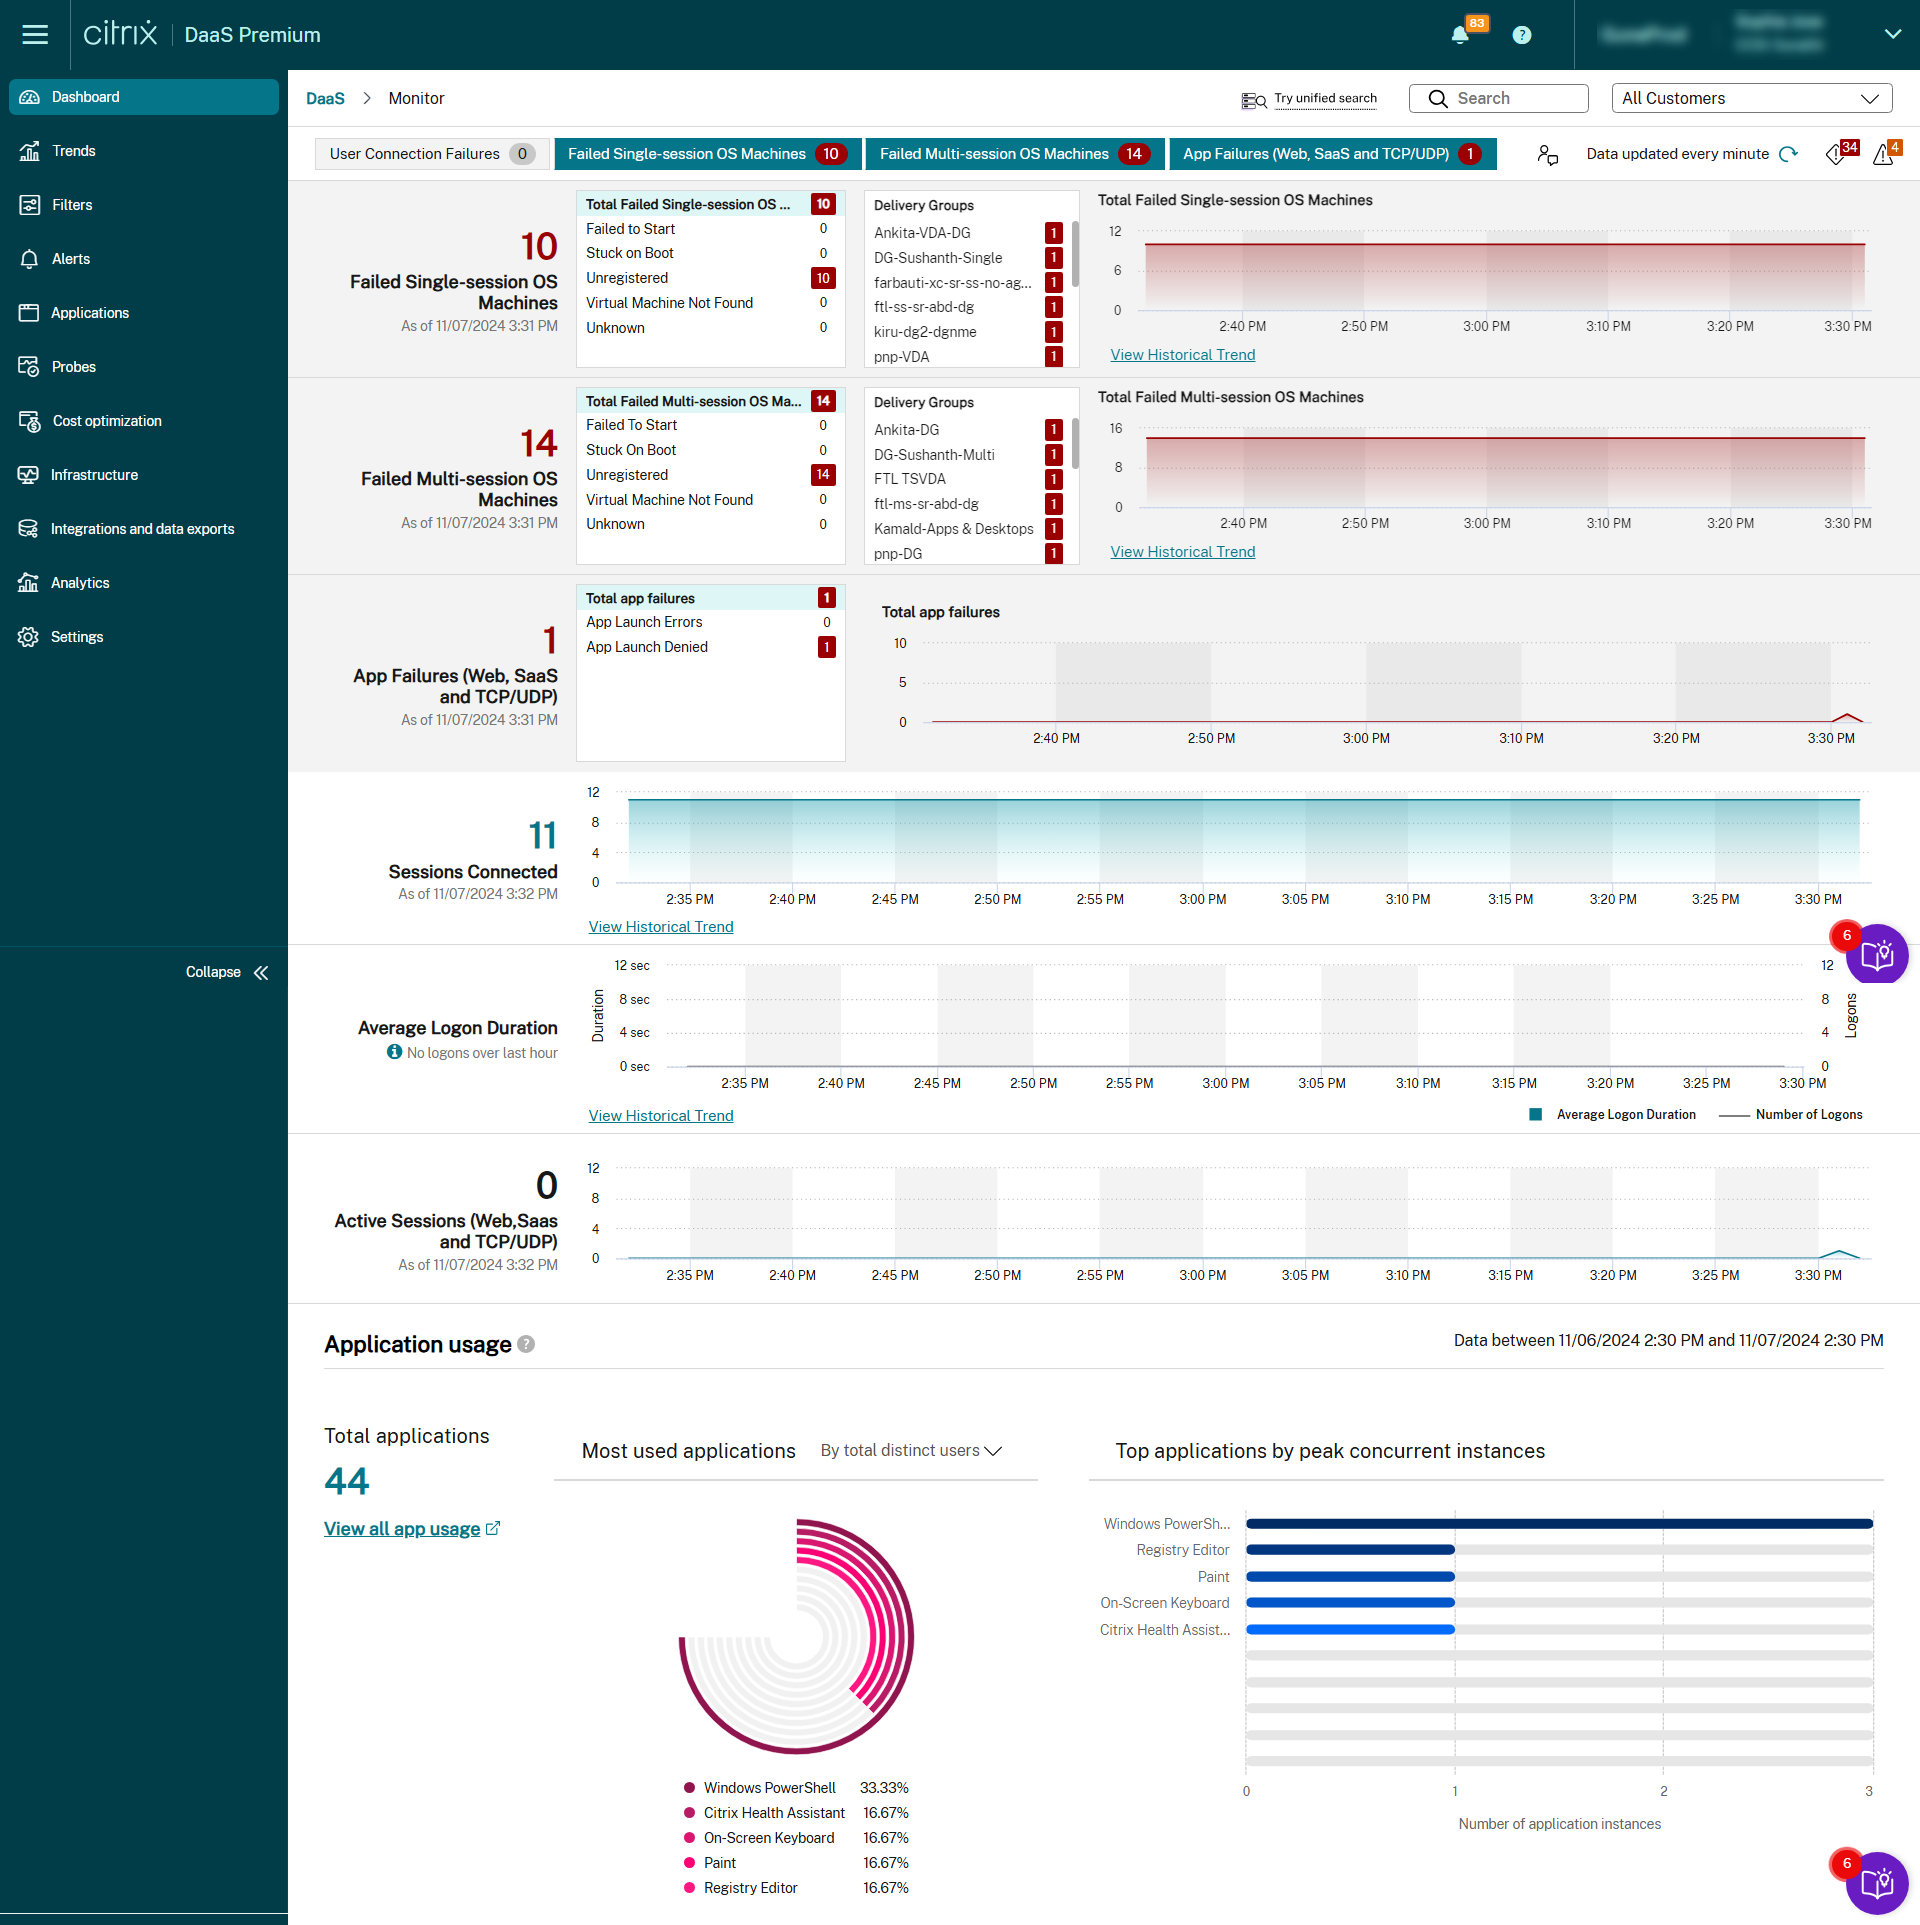
If there’re currently no failures and no failures have occurred in the past 60 minutes, the panels stay collapsed. When there are failures, the specific failure panel automatically appears.
| Panel | Description |
|---|---|
| User Connection Failures | Connection failures over the last 60 minutes. Click the categories next to the total number to view metrics for that type of failure. In the adjacent table, that number is further categorized based on each delivery group. Connection failures include failures caused by application limits being reached. For more information on application limits, see Applications. |
| Failed Single-session OS Machines or Failed Multi-session OS Machines | Total failures in the last 60 minutes categorized based on each delivery groups. Failures broken out by types, including failed to start, stuck on boot, and unregistered. For Multi-session OS machines, failures also include machines reaching maximum load. |
| Sessions Connected | Connected sessions across all delivery groups for the last 60 minutes. |
| Average Logon Duration | Log on data for the last 60 minutes. The large number on the left is the average logon duration across the hour. Log on data for VDAs earlier than XenDesktop 7.0 isn’t included in this average. For more information, see Diagnose user logon issues. |
| Total connected users | Shows the number of users who had at least one connection in the last 24 hours or last 7 days. This panel helps the admins to showcase adoption trends to their executives. |
| Citrix Workspace™ app versions found in your environment | Provides an overview of the Citrix Workspace app versions used across the organization. It helps in unifying the versions by showing how many devices are using different versions. By default, Citrix Workspace app version data for all OS platforms is displayed. You can view the version data for a specific OS platform by selecting the corresponding OS from the Platform drop-down list. |
Note:
When the type of host you’re using doesn’t support any particular metric, there’s no icon appears for that particular metric. For example, no health information is available for System Center Virtual Machine Manager (SCVMM) hosts, AWS and CloudStack.
Continue to troubleshoot issues using these options (which are documented in the preceding sections):
Monitor sessions
If a session becomes disconnected, it’s still active and its applications continue to run. However, the user device is no longer communicating with the server.
| Action | Description |
|---|---|
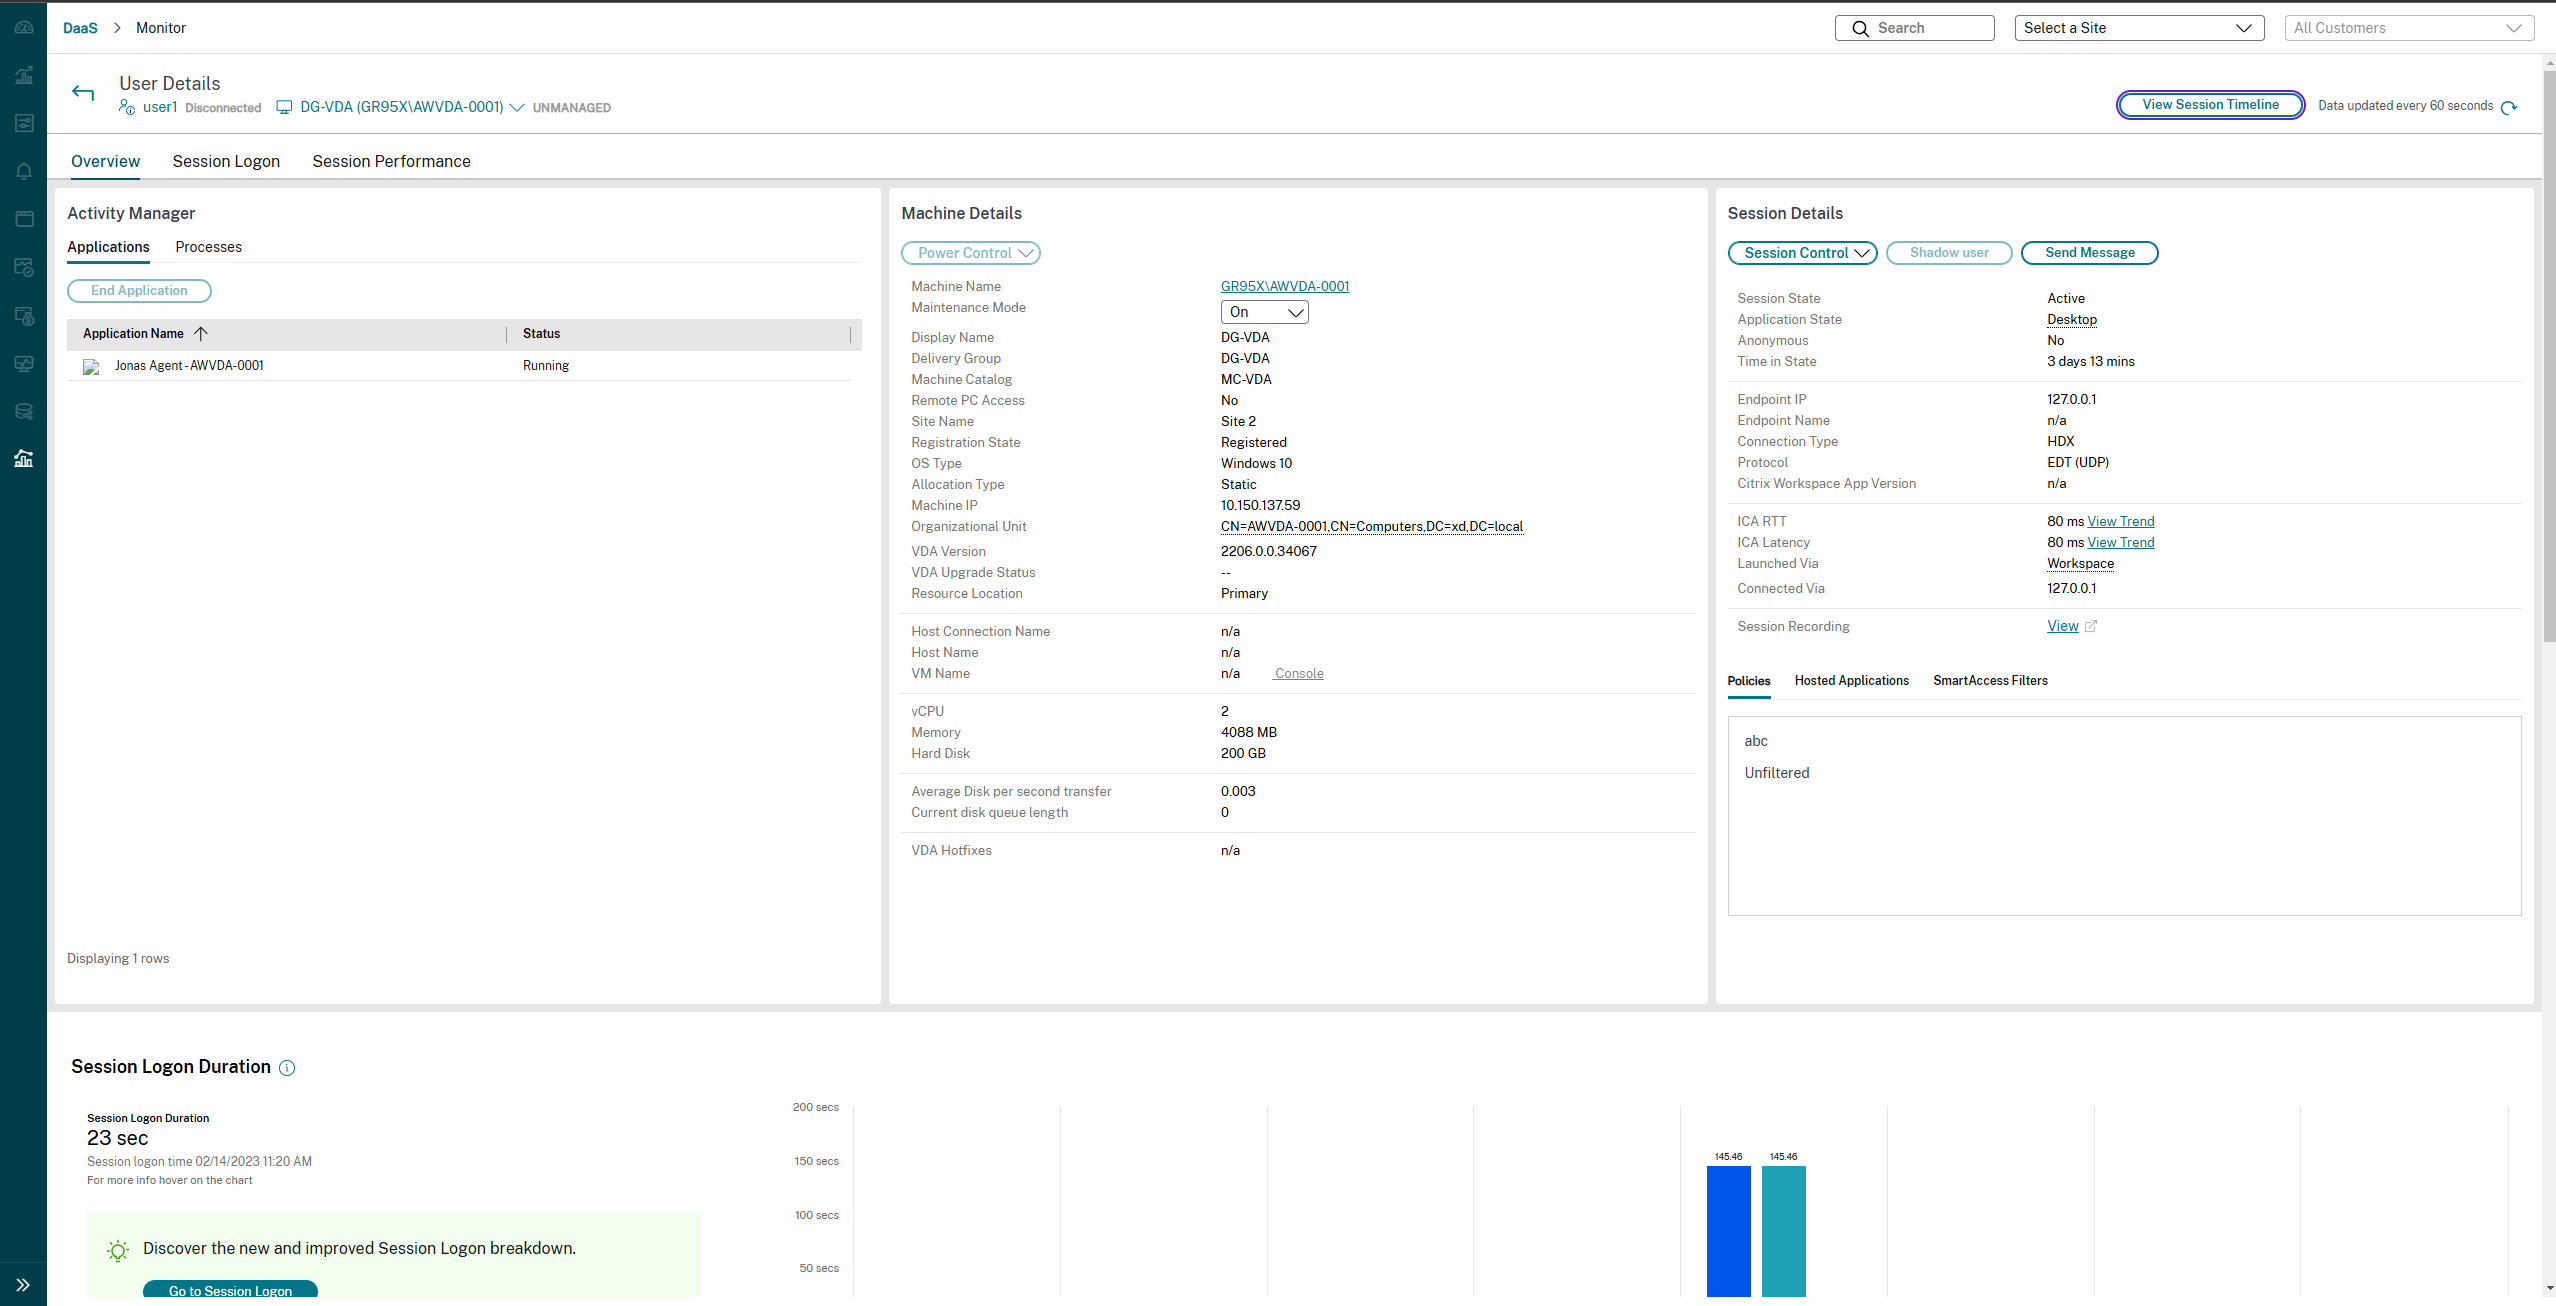
| View a user’s currently connected machine or session | From the Activity Manager and User Details views, view the user’s currently connected machine or session. Also, view a list of all machines and sessions to which this user has access. To access this list, click the session switcher icon in the user title bar. For more information, see Restore sessions. |
| View the total number of connected sessions across all delivery groups | From the Dashboard, in the Sessions Connected pane, view the total number of connected sessions across all delivery groups for the last 60 minutes. Then click the large total number, which opens the Filters view. Here, you can display graphical session data based on selected delivery groups and ranges and usage across delivery groups. |
| End idle sessions | The Sessions Filters view displays data related to all active sessions. You can filter the sessions that are based on Associated User, delivery group, Session State, and Idle Time greater than a threshold time period. From the filtered list, select sessions to log off or disconnect. For more information, see Troubleshoot applications. |
| View data over a longer period | On the Trends view, select the Sessions tab to drill down to more specific usage data. You can drill down data for connected and disconnected sessions over a longer period. You can view session totals from earlier than the last 60 minutes. To view this information, click View historical trends. |
Note:
Consider that a user device is running on a legacy Virtual Delivery Agent (VDA), such as a VDA earlier than version 7, or a Linux VDA. In this case, Monitor can’t display complete information about the session. Instead, it displays a message that the information isn’t available.
Desktop Assignment Rules limitation: Studio allows assignment of multiple Desktop Assignment Rules (DAR) for different users or user groups to a single VDA in the delivery group. StoreFront™ displays the assigned desktop with the corresponding Display Name as per the DAR for the logged in user. However, Monitor does not support DARs and displays the assigned desktop using the delivery group name regardless of the logged in user. As a result, you can’t map a specific desktop to a machine in Monitor.
You can map the assigned desktop that is displayed in StoreFront to the delivery group name that is displayed in Monitor. For mapping, use the following PowerShell command:
Get-BrokerDesktopGroup | Where-Object { $\_.Uid -eq (Get-BrokerAssignmentPolicyRule | Where-Object { $\_.PublishedName -eq "\<Name on StoreFront\>" }).DesktopGroupUid } | Select-Object -Property Name, Uid
<!--NeedCopy-->
Run the preceding PowerShell command using the Remote PowerShell SDK as described in the blog.
Disable the visibility of running applications in the Activity Manager
By default, the Activity Manager displays a list of all running applications for a user’s session. All administrators who have access to the Activity Manager feature can view this information. For Delegated Administrator roles, this view includes Full Administrator, delivery group Administrator, and Help Desk Administrator.
To protect the privacy of users and the applications that they’re running, you can disable the Applications tab to list running applications. To do this activity, on the VDA modify the registry key at HKEY_LOCAL_MACHINE\Software\Citrix\Director\TaskManagerDataDisplayed. By default, the key is set to 1. Change the value to 0, which means the information isn’t collected from the VDA and as such not displayed in the Activity Manager.
Warning:
Editing the registry incorrectly can cause serious problems that might require you to reinstall your operating system. Citrix® can’t guarantee that problems resulting from the incorrect use of the Registry Editor can be solved. Use Registry Editor at your own risk. Be sure to back up the registry before you edit it.
Access Citrix Analytics for Performance™ - Session Details
The Session Details page from Citrix Analytics for Performance can be accessed Monitor. Click View Session Timeline in the Sessions Details section of Activity Manager opens the Sessions Details page of Citrix Analytics for Performance within Monitor.
Note:
This feature requires you to have a valid Citrix Analytics for Performance entitlement.
Session Details are available for sessions that are categorized as Excellent, Fair, or Poor Citrix Analytics for Performance. For more information about reasons why a session might not be categorized, see the Not Categorized article.
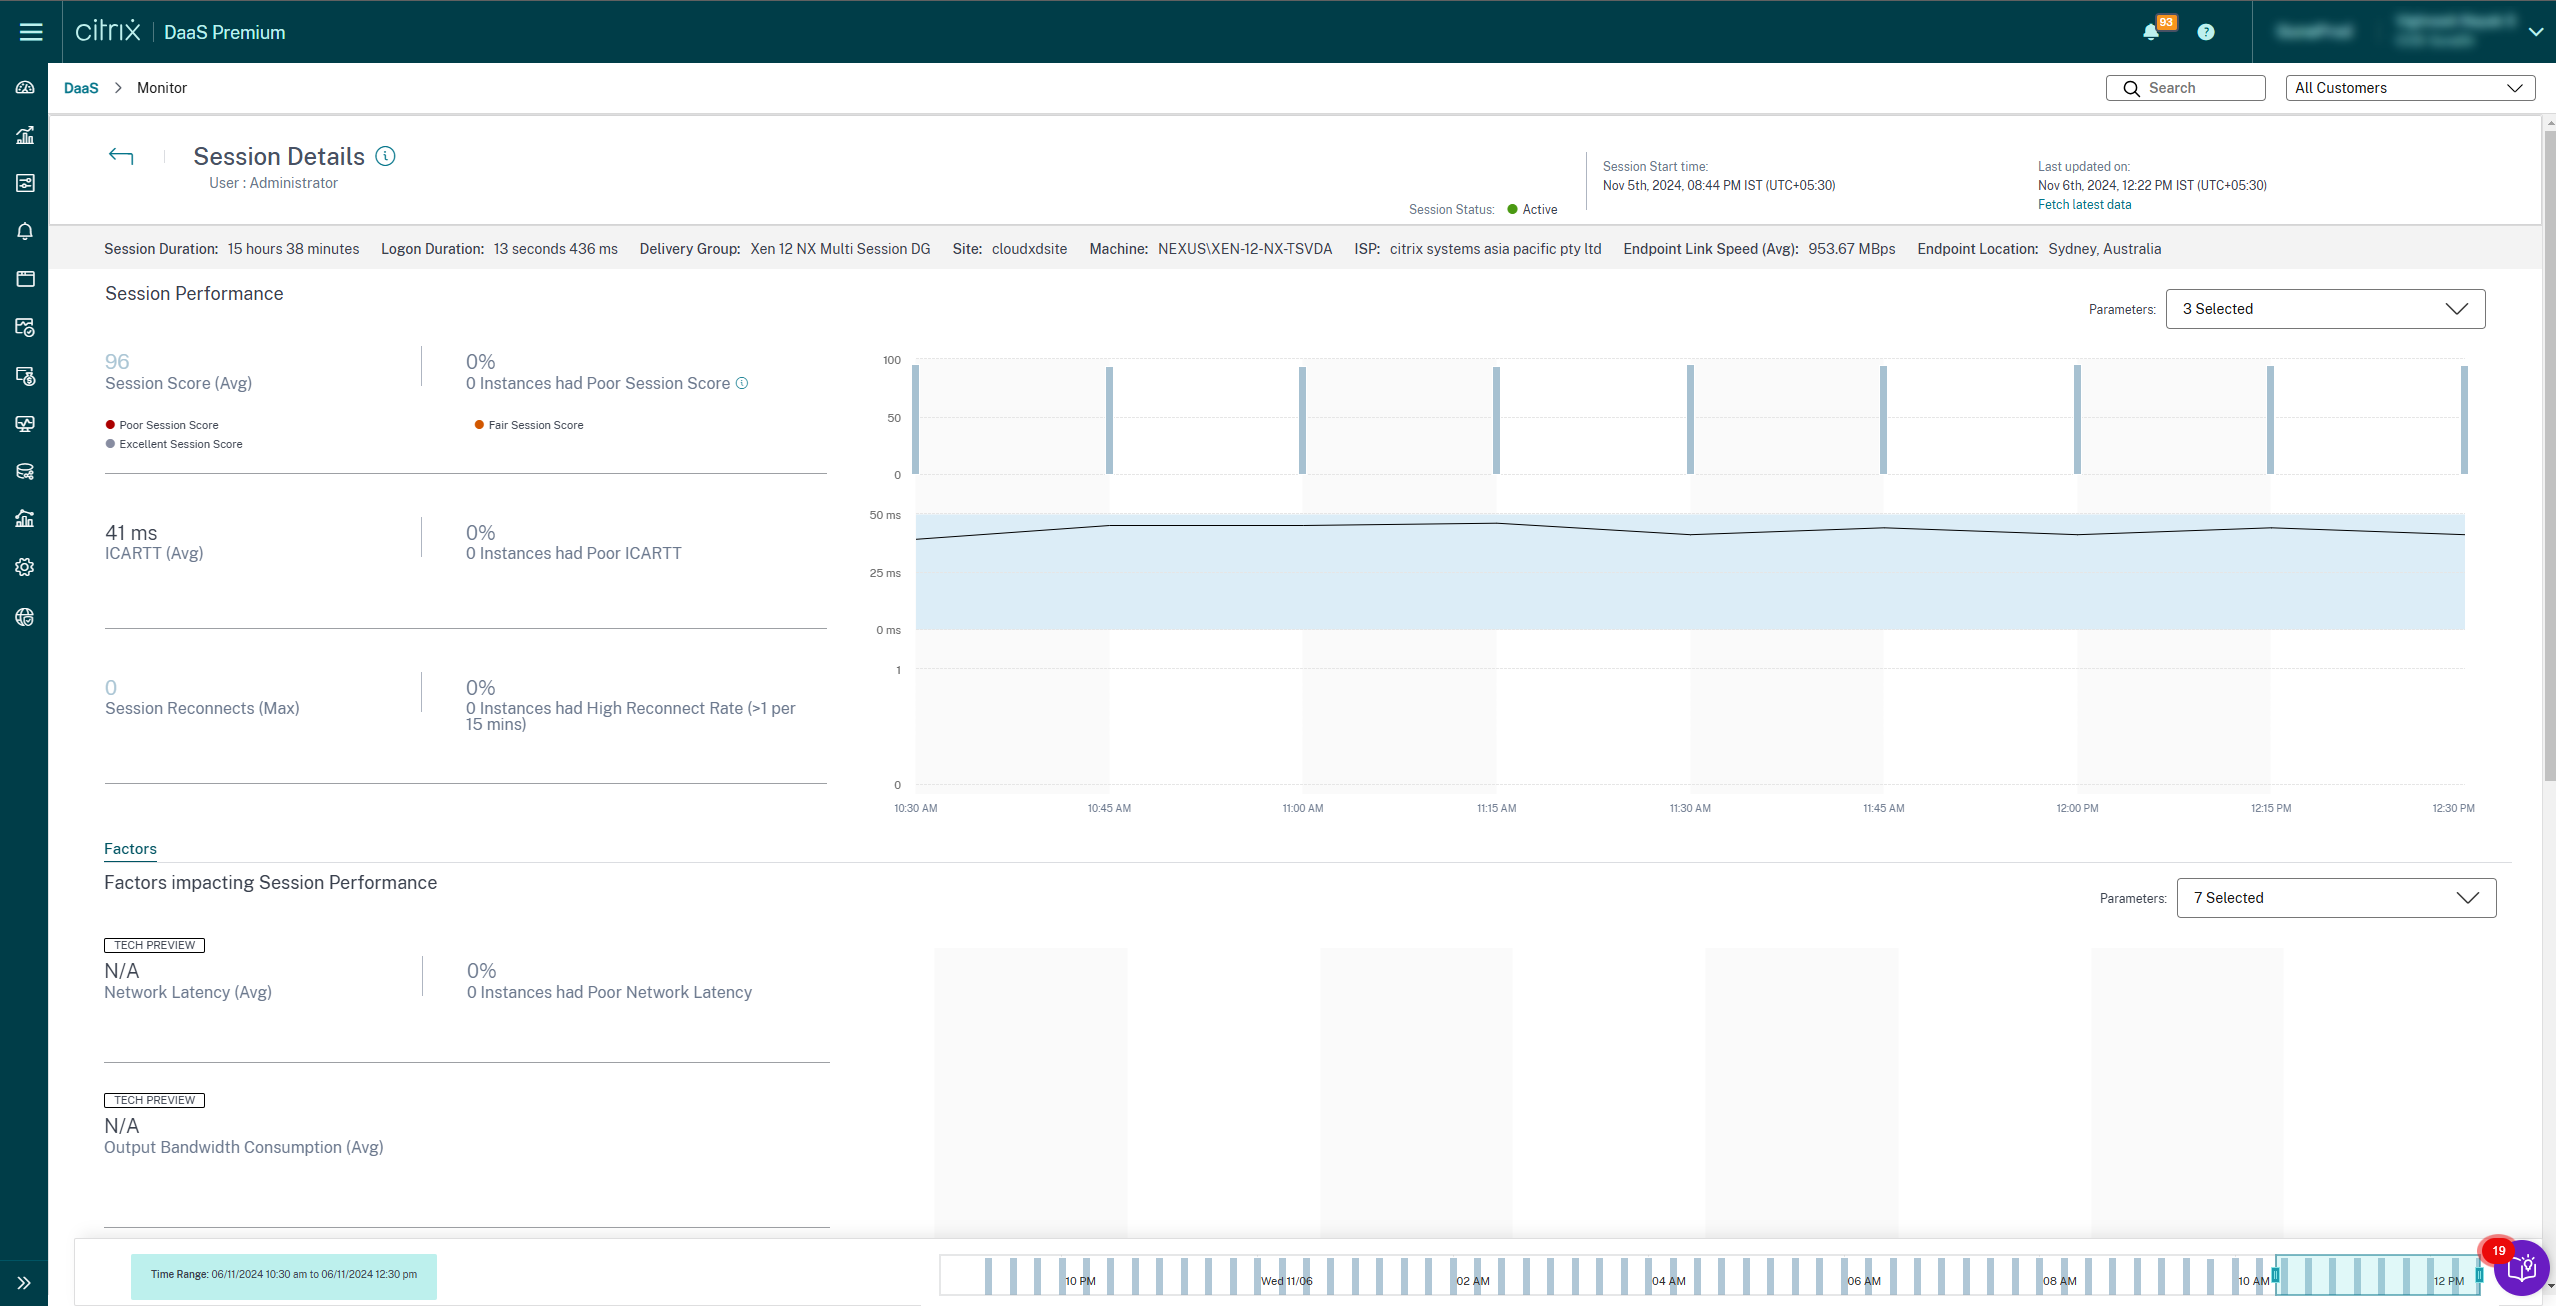
You can view a trend of the session experience for the session for up to the last three days. This trend view also includes the factors that contribute to the session experience. This information complements the live data available in Monitor, used by the help desk admin while troubleshooting issues related to session experience.
For more information about the Session Details page, see Session Details.
Session transport protocol
View the transport protocol in use for the HDX connection type for the current session in the Session Details panel. This information is available for sessions launched on VDAs Version 7.13 or later.
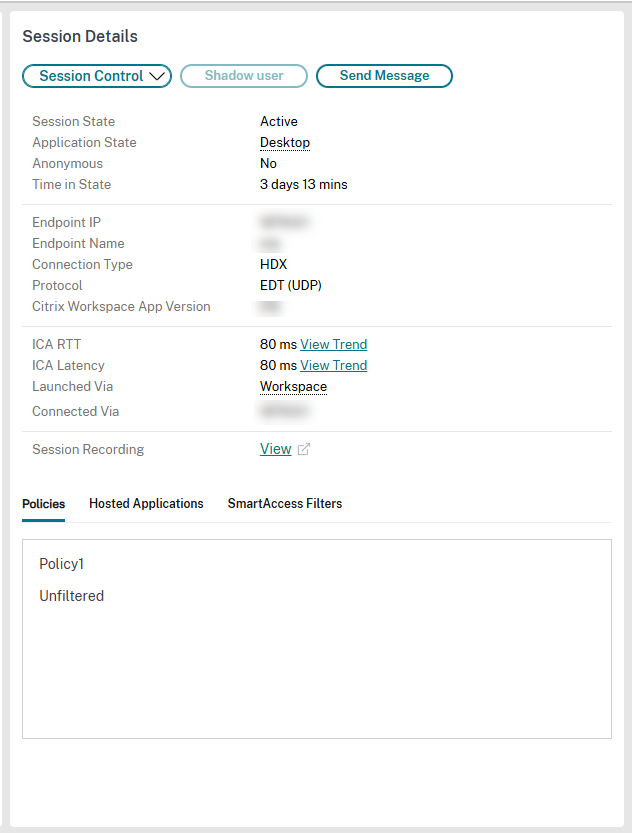
Use the Session Control drop-down menu in the Session Details pane to log off or disconnect a session.
- For HDX™ Connection type,
- The Protocol is displayed as UDP, if EDT is used for the HDX connection.
- The Protocol is displayed as TCP, if TCP is used for the HDX connection.
- For RDP Connection type, the Protocol is displayed as n/a.
When adaptive transport is configured, the session transport protocol dynamically switches between EDT (over UDP) and TCP, based on the network conditions. If the HDX session can’t be established using EDT, it falls back to the TCP protocol.
For more information about adaptive transport configuration, see Adaptive Transport.
Export reports
You can export trends data to generate regular usage and capacity management reports. Export supports PDF, Excel, and CSV report formats. Reports in PDF and Excel formats inculde trends represented as graphs and tables. Reports in CSV-format contain tabular data that you can use to generate views or to archive.
To export a report:
- Go to the Trends tab.
- Set filter criteria and time period and click Apply. The trend graph and table are populated with data.
- Click Export and enter the name and format of the report.
Monitor generates the report based on the filter criteria that you select. If you change the filter criteria, click Apply before you click Export.
Note:
Export of a large amount of data causes a significant increase in memory and CPU consumption on the Monitor server, the Delivery Controller™, and the SQL servers. The supported number of concurrent export operations and the amount of data that can be exported is set to default limits to achieve optimal export performance.
Supported export limits
Exported PDF and Excel reports contain complete graphical charts for the selected filter criteria. However, tabular data in all report formats is truncated beyond the default limits on the number of rows or records in the table. The default number of records supported is defined based on the report format.
| Report format | Default number of records supported |
|---|---|
| 500 | |
| Excel | 100,000 |
| CSV | 100,000 (10,000,000 in Sessions tab) |
Error Handling
Errors that you might encounter during an Export operation:
-
Director has timed out: This error can occur because of network issues or high resource usage on the Director server or with the Monitor Service.
-
Monitor has timed out: This error can occur because of network issues or high resource usage with the Monitor Service or on the SQL server.
-
Max concurrent Export or Preview operations ongoing: Only one instance of Export or Preview can run at a specific time. If you get the Max concurrent Export or Preview operations ongoing error, try the next operation again later.
Monitor hotfixes
To view the hotfixes installed on a specific machine VDA (physical or VM), choose the Machine Details view.
Control user machine power states
To control the state of the machines that you select in Monitor, use the Power Control options. These options are available for Single session OS machines, but might not be available for Multi-session OS machines.
Note:
This functionality isn’t available for physical machines or machines using Remote PC Access.
| Command | Function |
|---|---|
| Restart | Performs an orderly (soft) shutdown of the VM and all running processes are halted individually before restarting the VM. For example, select machines that appear in Monitor as “failed to start,” and use this command to restart them. |
| Force Restart | Restarts the VM without first doing any shut-down procedure. This command works in the same way as unplugging a physical server and then plugging it back in and turning it back on. |
| Shut Down | Performs an orderly (soft) shutdown of the VM. All running processes are halted individually. |
| Force Shutdown | Shuts down the VM without first doing any shut-down procedure. This command works in the same way as unplugging a physical server. It might not always shut down all running processes, and you risk losing data if you shut down a VM in this way. |
| Suspend | Suspends a running VM in its current state and stores that state in a file on the default storage repository. This option allows you to shut down the VM’s host server and later, after rebooting it, resume the VM, returning it to its original running state. |
| Resume | Resumes a suspended VM and restores its original running state. |
| Start | Starts a VM when it is off (also called a cold start). |
If power control actions fail, hover the mouse over the alert, and a pop-up message appears with details about the failure.
Prevent connections to machines
Use maintenance mode to prevent new connections temporarily while the appropriate administrator performs maintenance tasks on the image.
When you enable maintenance mode on machines, no new connections are allowed until you disable it. If users are currently logged on, maintenance mode takes effect when all users are logged off. For users who do not log off, send a message informing them that machines are shut down at a certain time. You can use the power controls to force the machines to shut down.
- Select the machine, such as from the User Details view, or a group of machines in the Filters view.
- Select Maintenance Mode, and turn on the option.
If a user tries to connect to an assigned desktop while it is in maintenance mode, a message appears to indicate that the desktop is unavailable. No new connections can be made until you disable maintenance mode.
Application Analytics
The Applications tab displays application-based analytics in a single, consolidated view to help analyze and manage application performance efficiently. You can gain valuable insight into the health and usage information of all applications published on the site. It shows metrics such as the following:
- Probe results
- Number of instances per application
- Faults and errors associated with the published applications
For more information, see the Application Analytics section in Troubleshooting Applications.