-
-
-
-
Eventlog Forwarding
-
-
This content has been machine translated dynamically.
Dieser Inhalt ist eine maschinelle Übersetzung, die dynamisch erstellt wurde. (Haftungsausschluss)
Cet article a été traduit automatiquement de manière dynamique. (Clause de non responsabilité)
Este artículo lo ha traducido una máquina de forma dinámica. (Aviso legal)
此内容已经过机器动态翻译。 放弃
このコンテンツは動的に機械翻訳されています。免責事項
이 콘텐츠는 동적으로 기계 번역되었습니다. 책임 부인
Este texto foi traduzido automaticamente. (Aviso legal)
Questo contenuto è stato tradotto dinamicamente con traduzione automatica.(Esclusione di responsabilità))
This article has been machine translated.
Dieser Artikel wurde maschinell übersetzt. (Haftungsausschluss)
Ce article a été traduit automatiquement. (Clause de non responsabilité)
Este artículo ha sido traducido automáticamente. (Aviso legal)
この記事は機械翻訳されています.免責事項
이 기사는 기계 번역되었습니다.책임 부인
Este artigo foi traduzido automaticamente.(Aviso legal)
这篇文章已经过机器翻译.放弃
Questo articolo è stato tradotto automaticamente.(Esclusione di responsabilità))
Translation failed!
Event Log Forwarding
uberAgent® can collect Windows system logs like Application, Security, System, etc. Events can be filtered based on their provider, event ID, and level (Information, Error, etc.). Additionally, more fine-grained event-filtering is possible with the XPath-querying functionality.
Requirements
- Eventlog forwarding is supported on Windows and macOS
- uberAgent 7.3 or later on Windows, uberAgent 7.5 or later on macOS
Configuring Eventlog Forwarding for Windows
Eventlog forwarding is configured with a configuration file. By default, no logs are collected. Eventlog collection needs to be enabled by an administrator.
The [EventLog] Stanza
The stanza [EventLog] starts a new log configuration, followed by multiple settings.
| Setting | Description | Required | Values |
|---|---|---|---|
| EventLog | The name of the event log to query. | Yes | Any valid log name, like System. |
| LevelName | The event’s level. Specify multiple levels separated by commas. | Yes |
Information, Warning, Error, Critical, Verbose
|
| EventID | Limit the collection to specific event IDs. Specify multiple IDs separated by commas. | No | Any valid event IDs |
| EventFilterXPath | Limit the collection with a XPath filter. XPath uses path expressions to select nodes or node-sets in an XML document. The node is selected by following a path or steps. | No | Any valid XPath filter. |
| Provider | Limit the collection to specific providers. | No | Any valid provider name. |
Collection Frequency
Eventlogs can be queried on a configurable schedule, or on-demand.
Schedule
To schedule the log collection, first create a new [EventLog] stanza.
[EventLog Name=TimerBased-System-Errors-Warnings]
EventLog = System
LevelName = Error,Warning
<!--NeedCopy-->
Second, create a new timer and reference the name the Eventlog stanza’s name.
[Timer]
Name = System Eventlog collection
EventLog = TimerBased-System-Errors-Warnings
Interval = 60000
<!--NeedCopy-->
On-demand
Create a new [EventLog] stanza without a corresponding timer. When uberAgent can’t find the Eventlog stanza’s name in any timer, it collects events as they occur.
[EventLog Name=OnDemand-Security-Events]
EventLog = Security
LevelName=Information
<!--NeedCopy-->
Collecting events as they occur can be resource intensive. Hence, collecting on a schedule is the preferred option.
Configuring Eventlog Forwarding for macOS
As with Windows, Eventlog forwarding is configured using a configuration file. By default, no logs are collected. Eventlog collection must be configured and enabled by an administrator.
The [EventLog] Stanza
The stanza [EventLog] starts a new log configuration, followed by multiple settings.
| Setting | Description | Required | Example |
|---|---|---|---|
| Predicate | A valid predicate filter (see the man page for the log command) | Yes | process == “uberAgent” |
| RateLimit | Specifies the maximum number of messages to retrieve per timer interval. The default is 500. | No | 1000 |
| MaxMessageLen | Limits an event’s message text to the specified length. | No | 100 |
Collection Frequency
Eventlogs can only be queried on a configurable schedule.
Schedule
To schedule the log collection, create a new [EventLog] stanza with a unique name and valid predicate as a first step for example:
Example 1
Filters log entries to forward only those created by the process named Finder. Use this to troubleshoot or monitor activity specific to the Finder process.
[EventLog Name=TimerBased-Messages]
Predicate = process == "Finder"
<!--NeedCopy-->
Example 2
Filters log entries to forward only those with a message type of error. Use this to quickly identify and investigate error events in the logs.
[EventLog Name=TimerBased-Messages]
Predicate = messageType == error
<!--NeedCopy-->
Example 3
Filters log entries to forward only those generated by the Finder process where the message type is info or the event message starts with ThumbnailCache. Use this to monitor Finder’s informational events and track thumbnail cache operations for troubleshooting or analysis.
[EventLog Name=TimerBased-Messages]
Predicate = process == "Finder" AND (messageType == info OR eventMessage BEGINSWITH "ThumbnailCache")
<!--NeedCopy-->
For a comprehensive list of available predicates and comparison operators, refer to the log tool’s manual page by running man log. For a more detailed overview, including documentation for wild card usage, you may also execute log help predicates.
NOTE:
To forward log messages where messageType == debug or logType == debug, you must set the system-wide log level to debug using the following command:
sudo log config --mode level:debug
Please note that this setting will automatically revert to INFO after a system restart, due to performance considerations and the high volume of debug messages. To maintain this configuration across reboots, consider using a startup script or a launch daemon.
The second step involves creating a new timer and referencing the name of the Eventlog stanza.
[Timer]
Name = System Eventlog collection
EventLog = TimerBased-Messages
Interval = 60000
<!--NeedCopy-->
Default Configuration
uberAgent does not collect any logs by default. Event log collection needs to be enabled by an administrator. However, the infrastructure is already prepared. uberAgent comes with the files uberAgent-ESA-eventlog-windows.conf and uberAgent-ESA-eventlog-macOS.conf, which hold a few, platform specific, examples that can be activated by uncommenting the lines.
Metadata
Sourcetype
-
Windows Eventlog events are sent with the sourcetype
uberAgentESA:System:WinEvtLogForwarding -
macOS Eventlog events are sent with the sourcetype
uberAgentESA:System:MacOsSystemLogForwarding
See the documentation for details.
Visualization
The collected Eventlogs are visualized on the Windows Eventlogs and macOS System Logs dashboards in the uberAgent ESA Splunk app. Below is a sample overview of Windows events. The macOS dashboard offers equivalent functionality while delivering macOS-specific information.
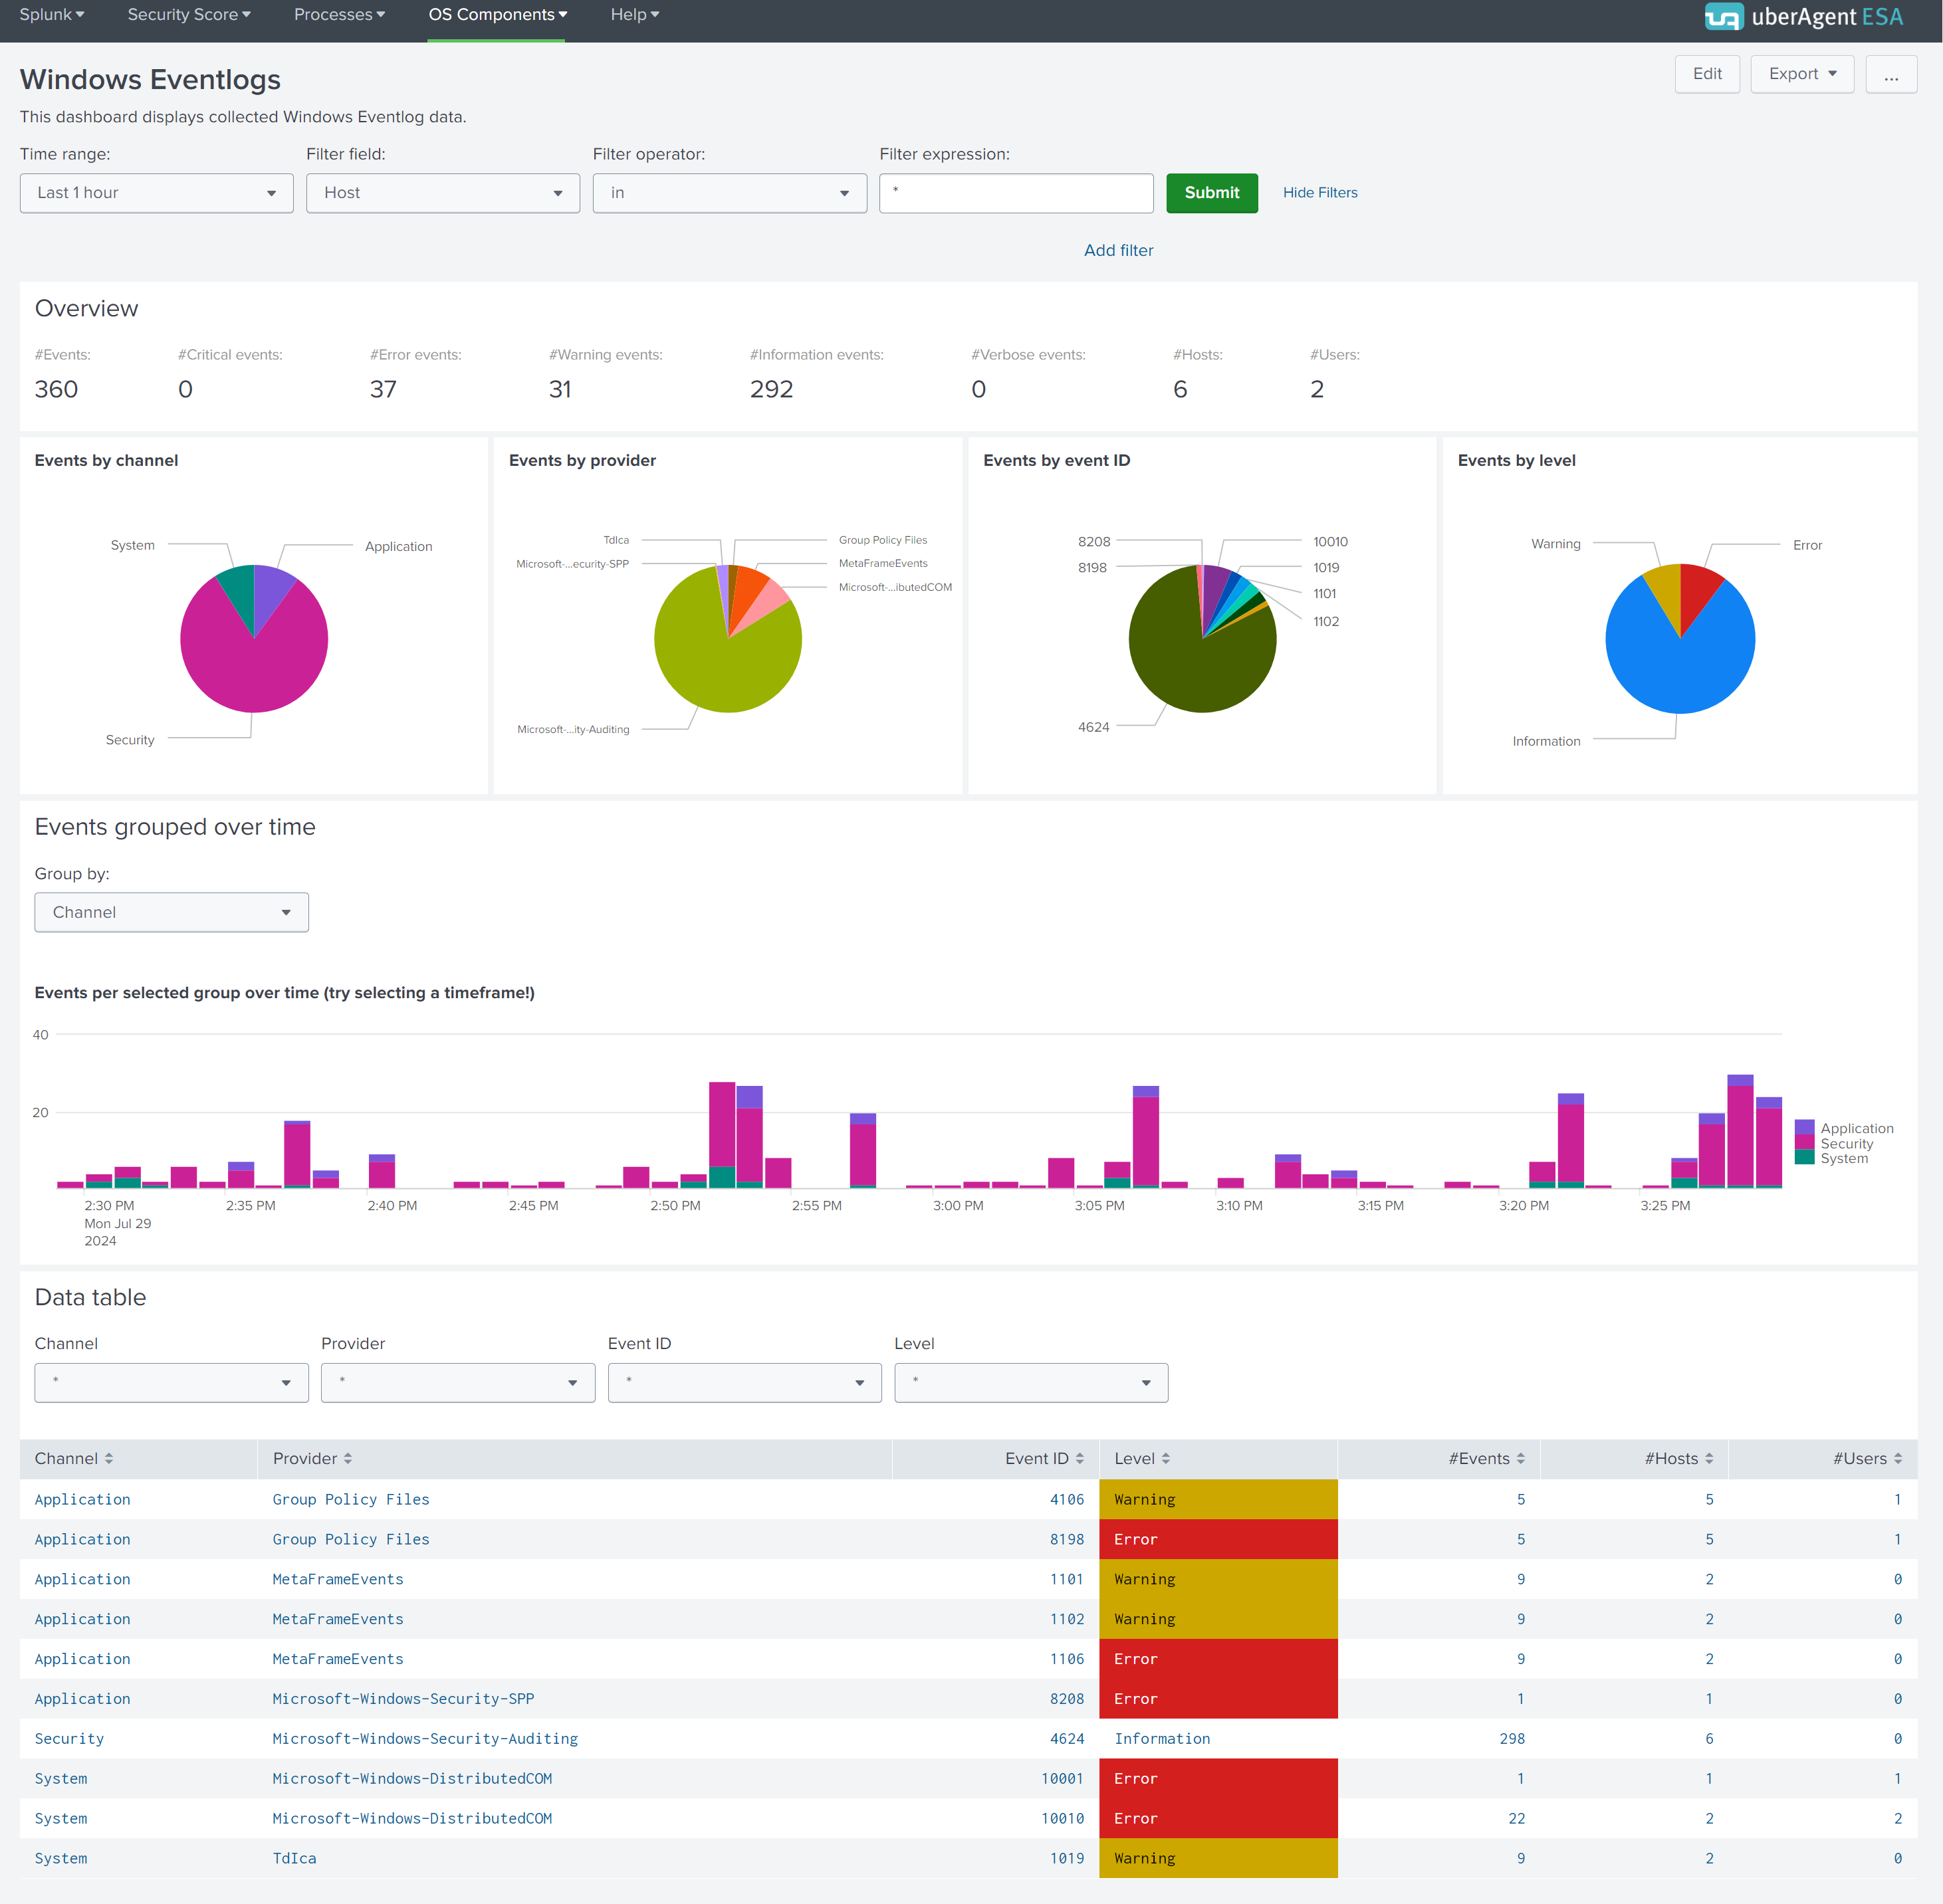
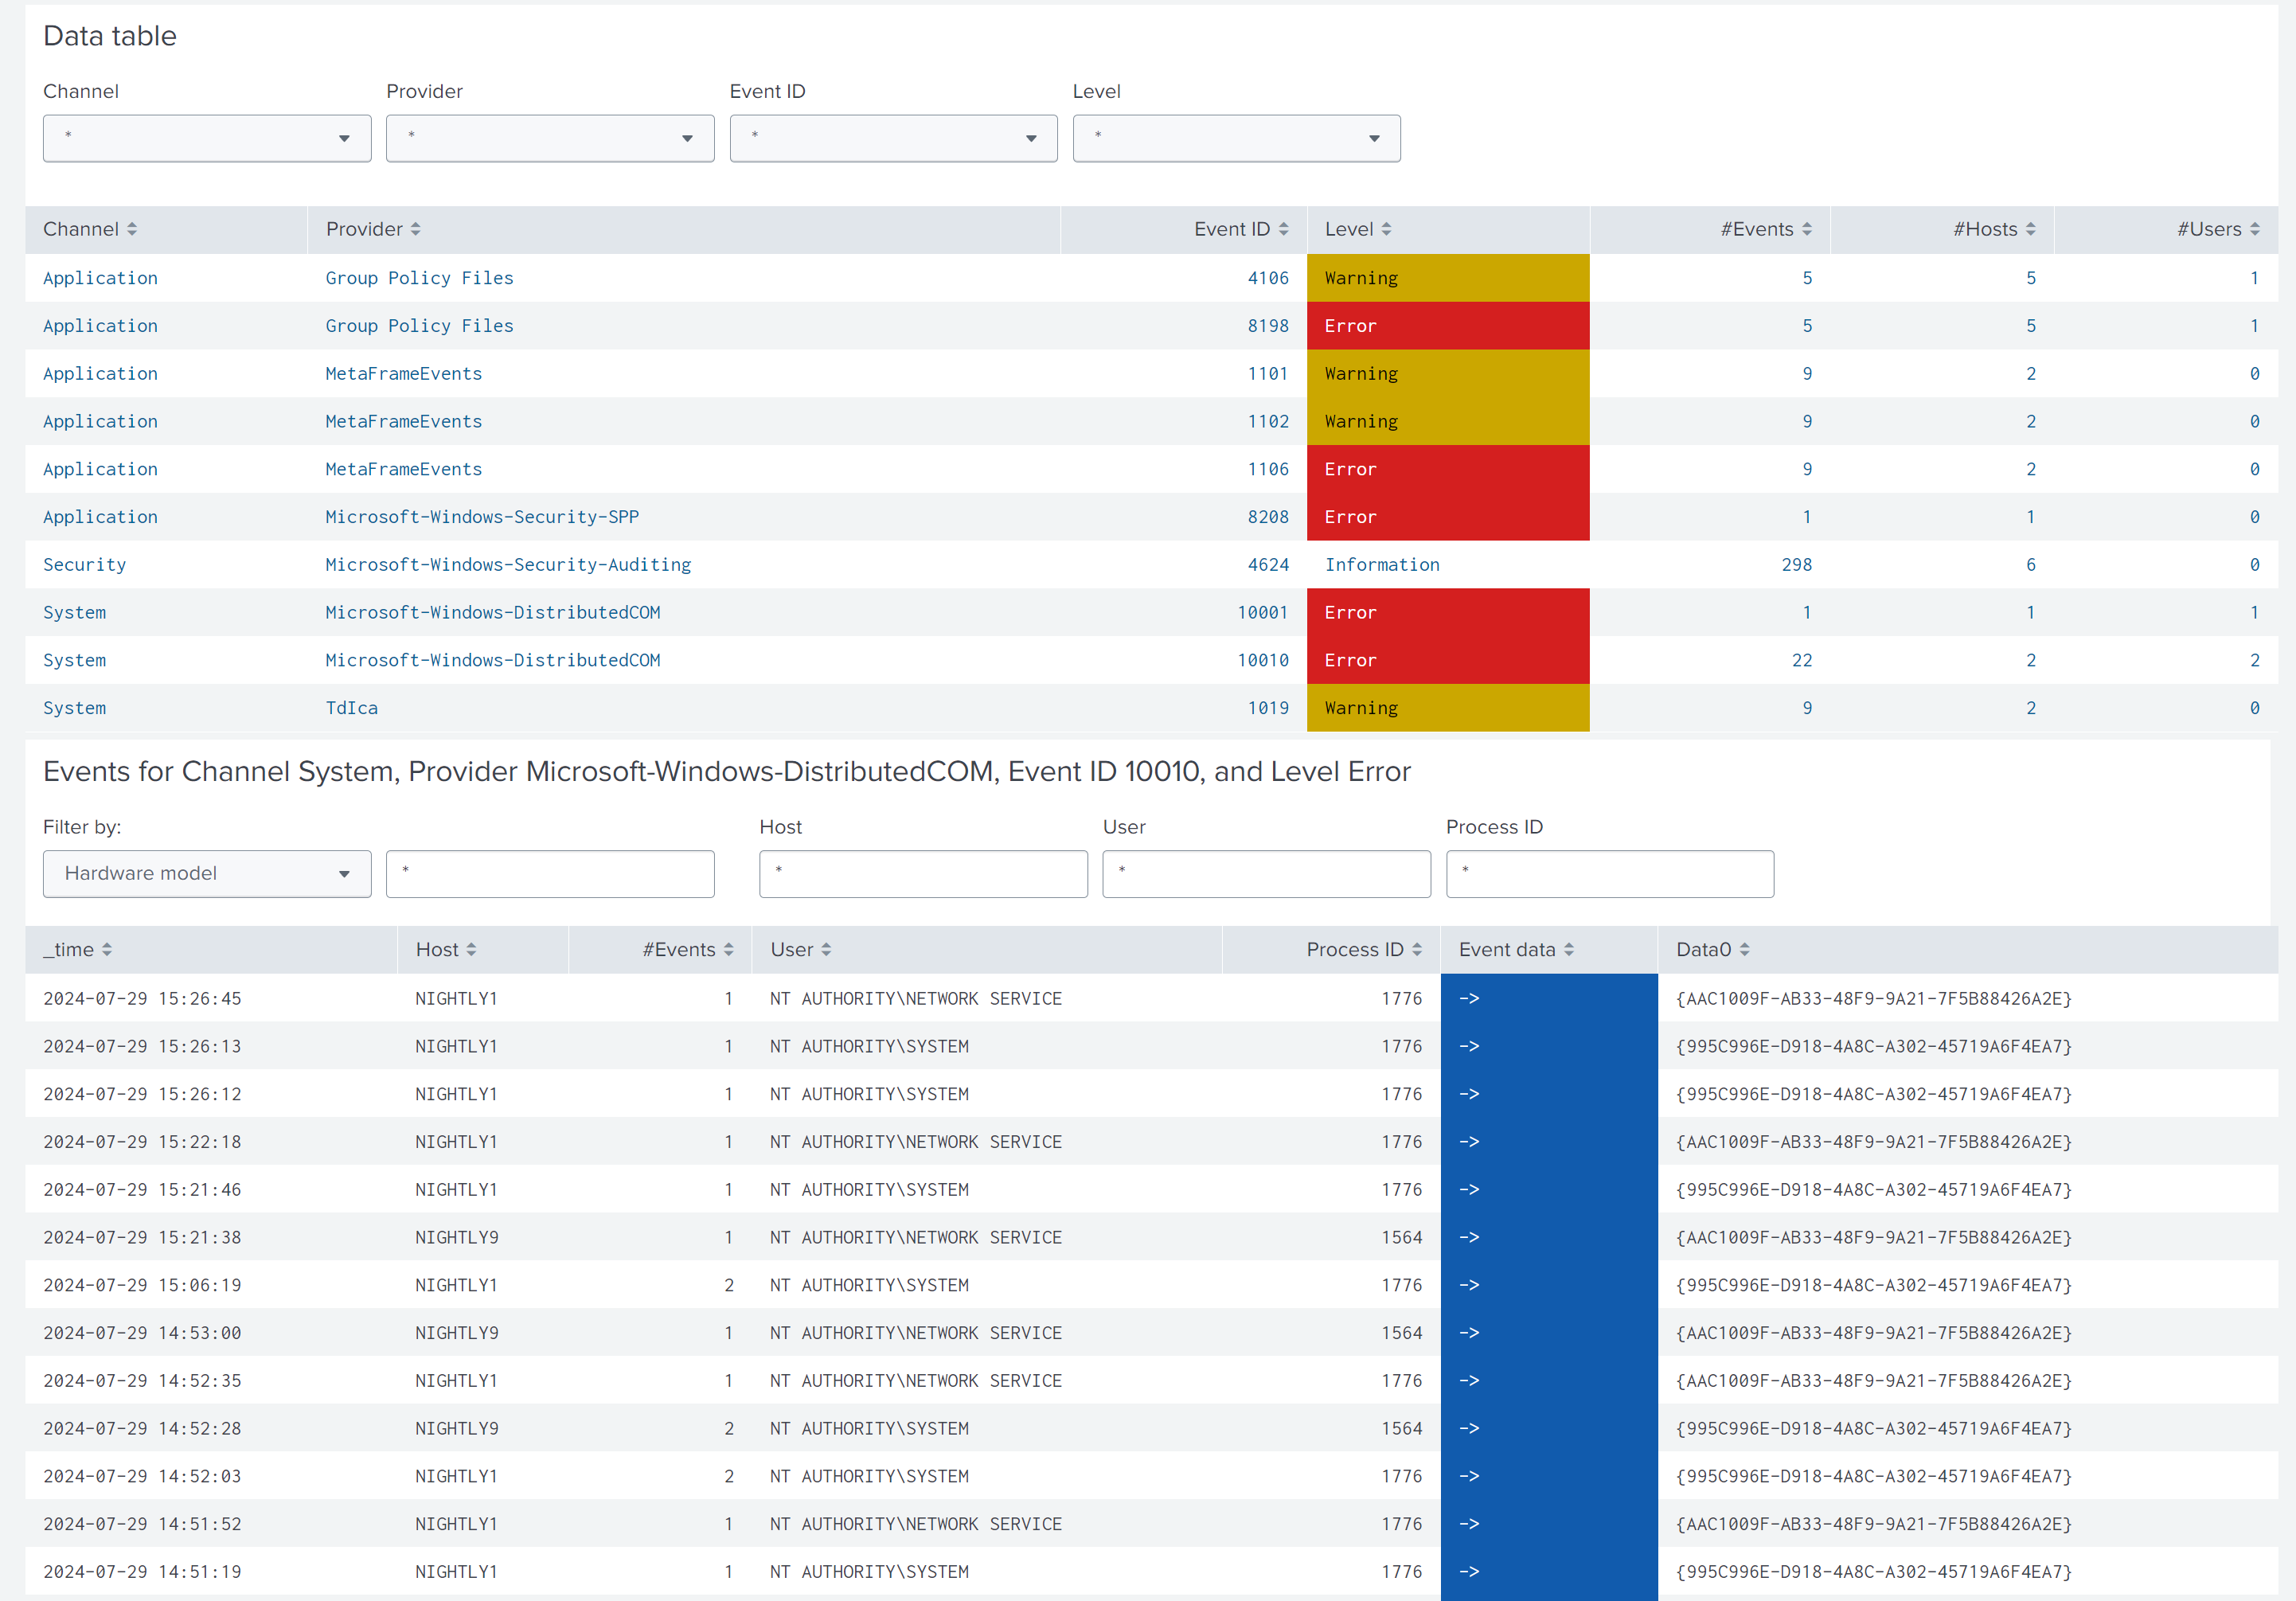
While the first charts give an overview of the collected Eventlogs, the data table at the bottom lists all of them grouped by channel, provider, ID, and level. Click a row in the table and a new chart with all details opens below. You can use the provided filter panels to limit the output to specific hosts, users, or process IDs.
Share
Share
This Preview product documentation is Citrix Confidential.
You agree to hold this documentation confidential pursuant to the terms of your Citrix Beta/Tech Preview Agreement.
The development, release and timing of any features or functionality described in the Preview documentation remains at our sole discretion and are subject to change without notice or consultation.
The documentation is for informational purposes only and is not a commitment, promise or legal obligation to deliver any material, code or functionality and should not be relied upon in making Citrix product purchase decisions.
If you do not agree, select I DO NOT AGREE to exit.