サードパーティSIEMの統合
概要
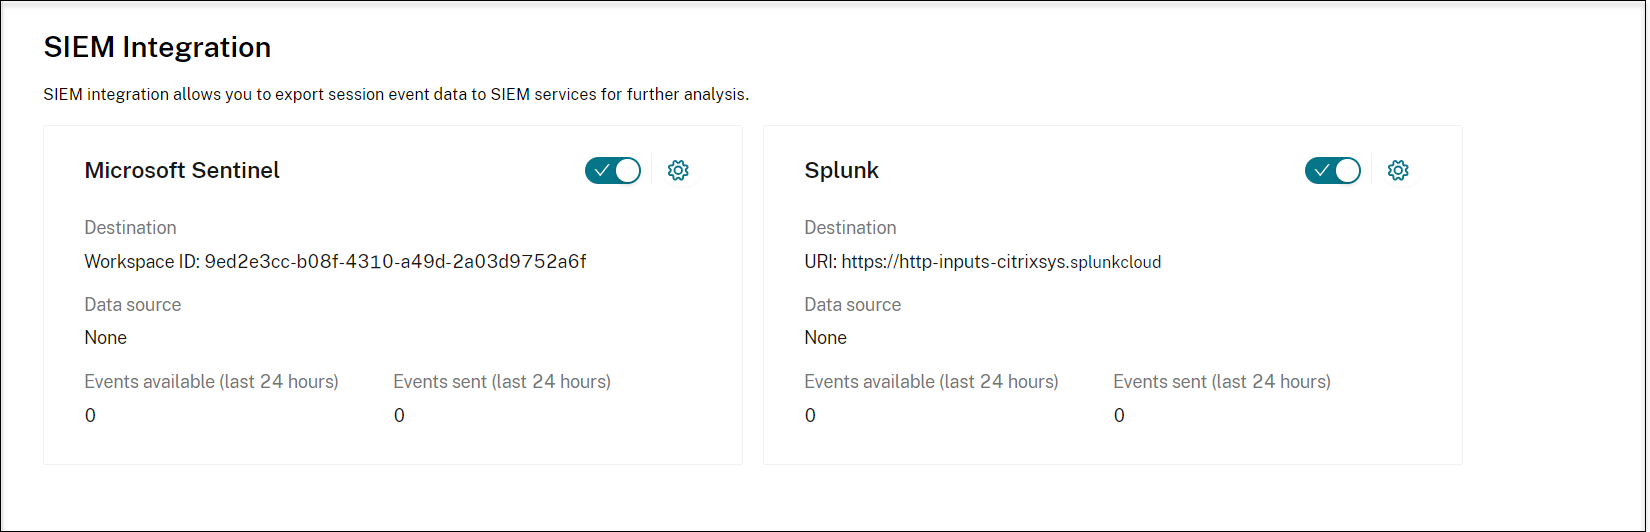
Session Recordingは、録画されたセッション内のさまざまなイベントをキャプチャする機能を提供します。 選択したイベントデータセットをSession Recordingサービスにアップロードし、サードパーティのセキュリティ情報とイベント管理(SIEM)システムに転送してさらに分析することができます。 現在、Session Recordingサービスは、Splunk(Splunk CloudとSplunk Enterpriseの両方)およびMicrosoft Sentinelとの統合をサポートしています。
サードパーティのSIEMプラットフォームと統合すると、高度な分析機能と相関機能を活用して潜在的な脅威をより効果的に検出し、対応できるため、組織のセキュリティ態勢が強化されます。
構成
-
SIEMの統合を有効にします。
-
Session Recordingサービスの左側ナビゲーションで、[構成]>[SIEM Integration]を選択します。
-
必要に応じて、Microsoft Sentinel、Splunk、またはその両方を有効にします。 次に、トグルの横にある 構成 アイコンをクリックして、宛先とデータ ソースを構成します。
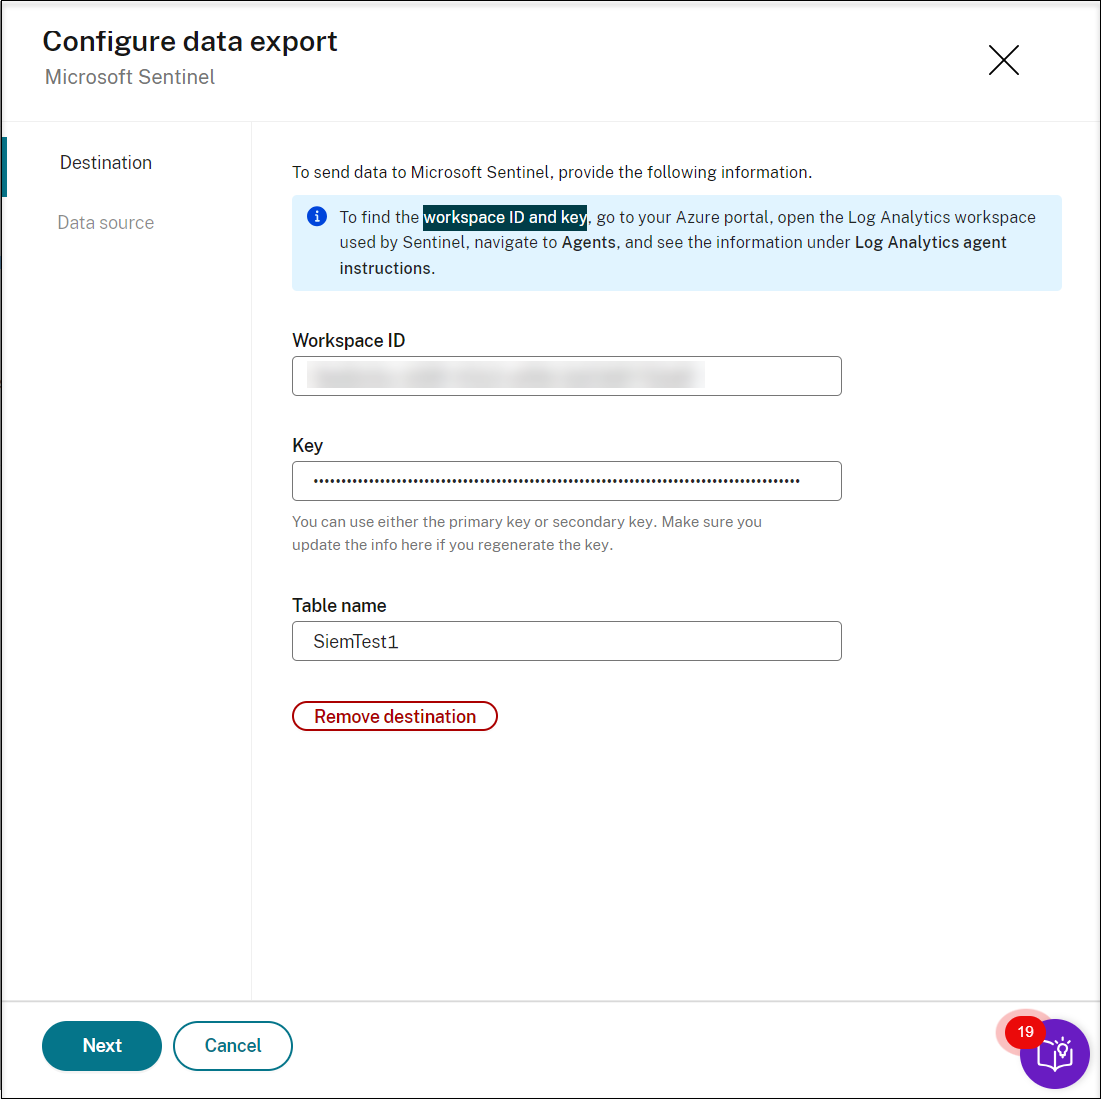
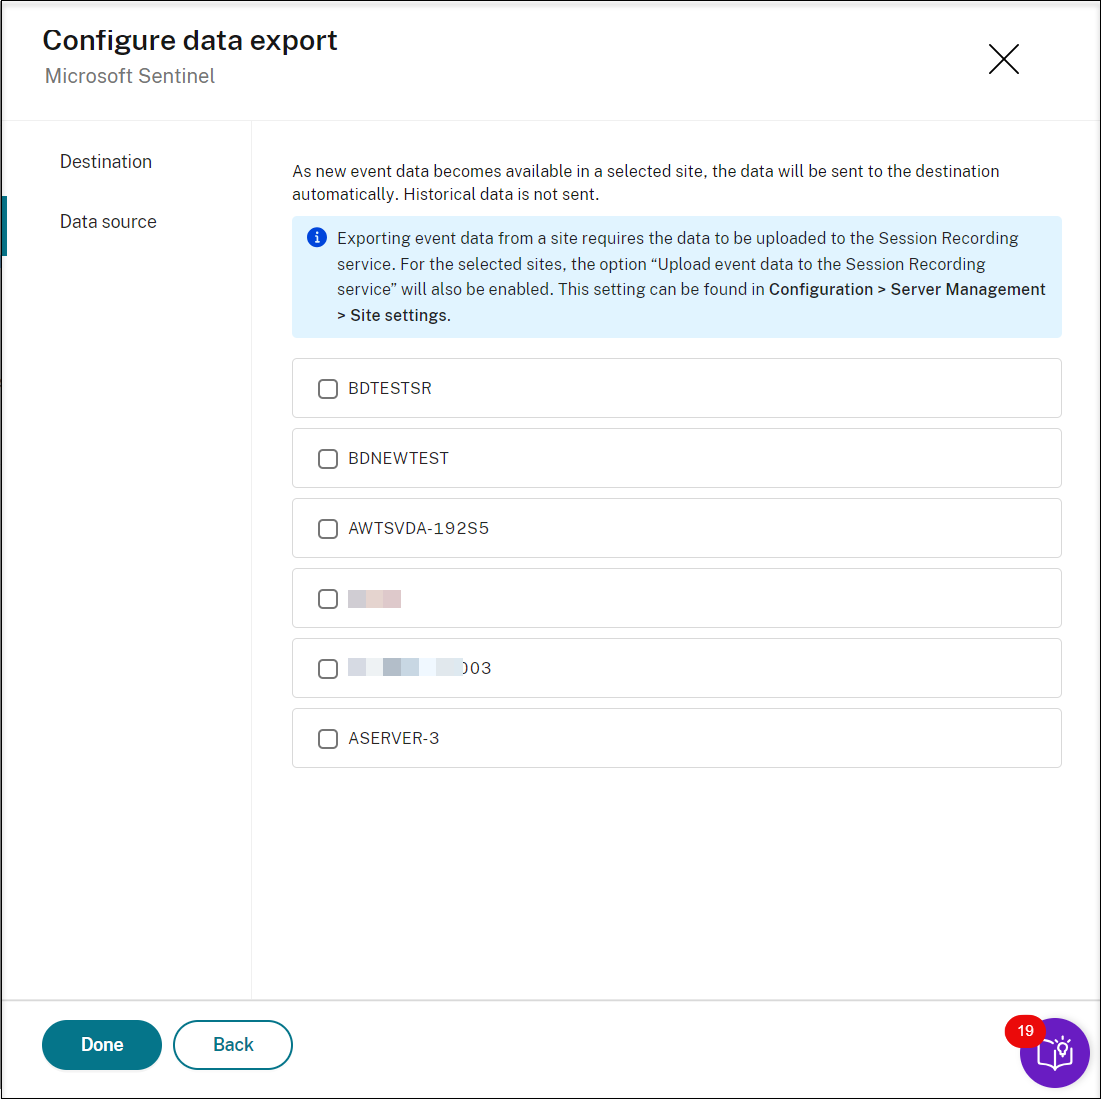
Microsoft Sentinelにデータを送信するには、Microsoft Sentinelの送信先のワークスペースIDとキーを指定し、送信するデータのソースとしてターゲットサイトを選択します。 SIEMの統合では、Session Recordingバージョン2411以降を含むサイトのみがサポートされます。
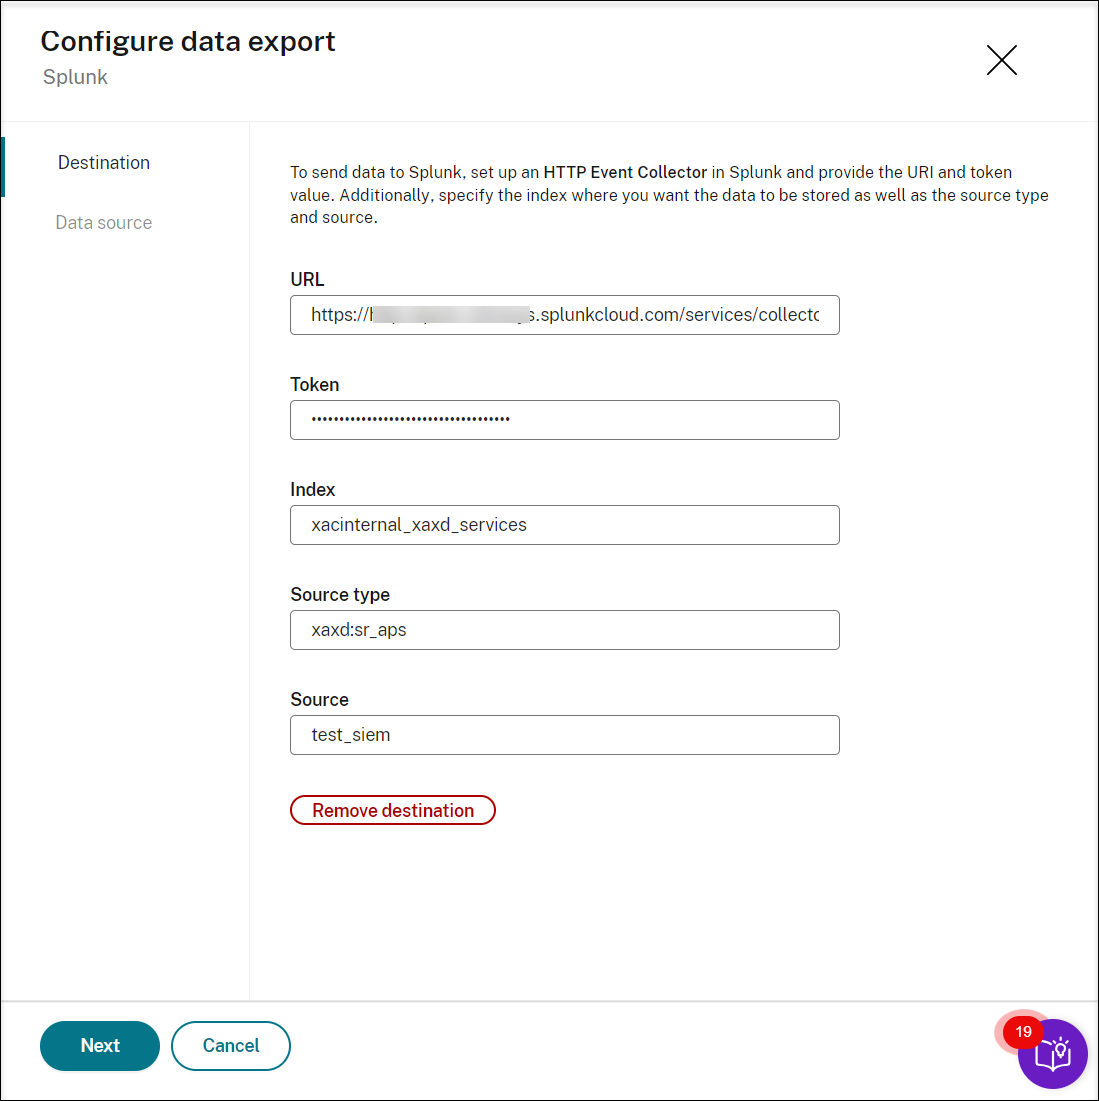
Splunkにデータを送信するには、SplunkでHTTPイベントコレクターを設定します。 手順については、Splunkのドキュメントを参照してください:Set up and use HTTP Event Collector in Splunk Web。 Session Recordingサービスは、Splunk CloudとSplunk Enterpriseの両方をサポートします。 Splunk Enterpriseを使用している場合は、Session Recordingサービス(現在Microsoft Azureでホストされています)からSplunk Enterpriseへの受信接続が構成されていることを確認してください。
URL、トークン値を指定し、ソースの種類とソースに加えて、データを保存するインデックスを指定します。 次に、Microsoft Sentinelと同様に、送信するデータのソースとしてターゲットサイトを選択します。 SIEMの統合では、Session Recordingバージョン2411以降を含むサイトのみがサポートされます。
-
-
転送するイベントを指定します。
Session Recordingサービスにアップロードし、先ほど指定したSIEMプラットフォームに転送するイベントの種類を指定する必要があります。 このためには、次の手順を実行します:
-
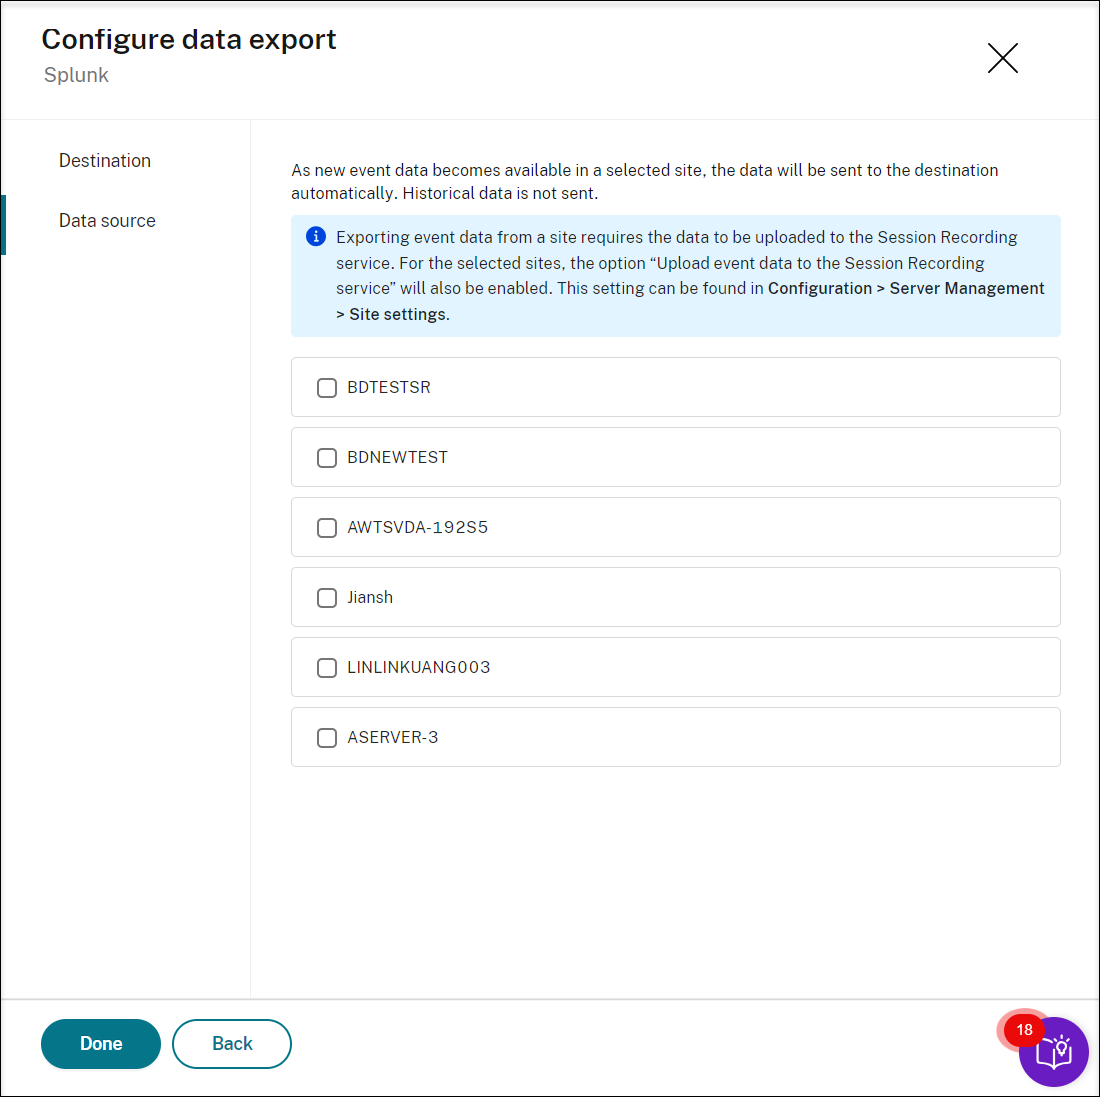
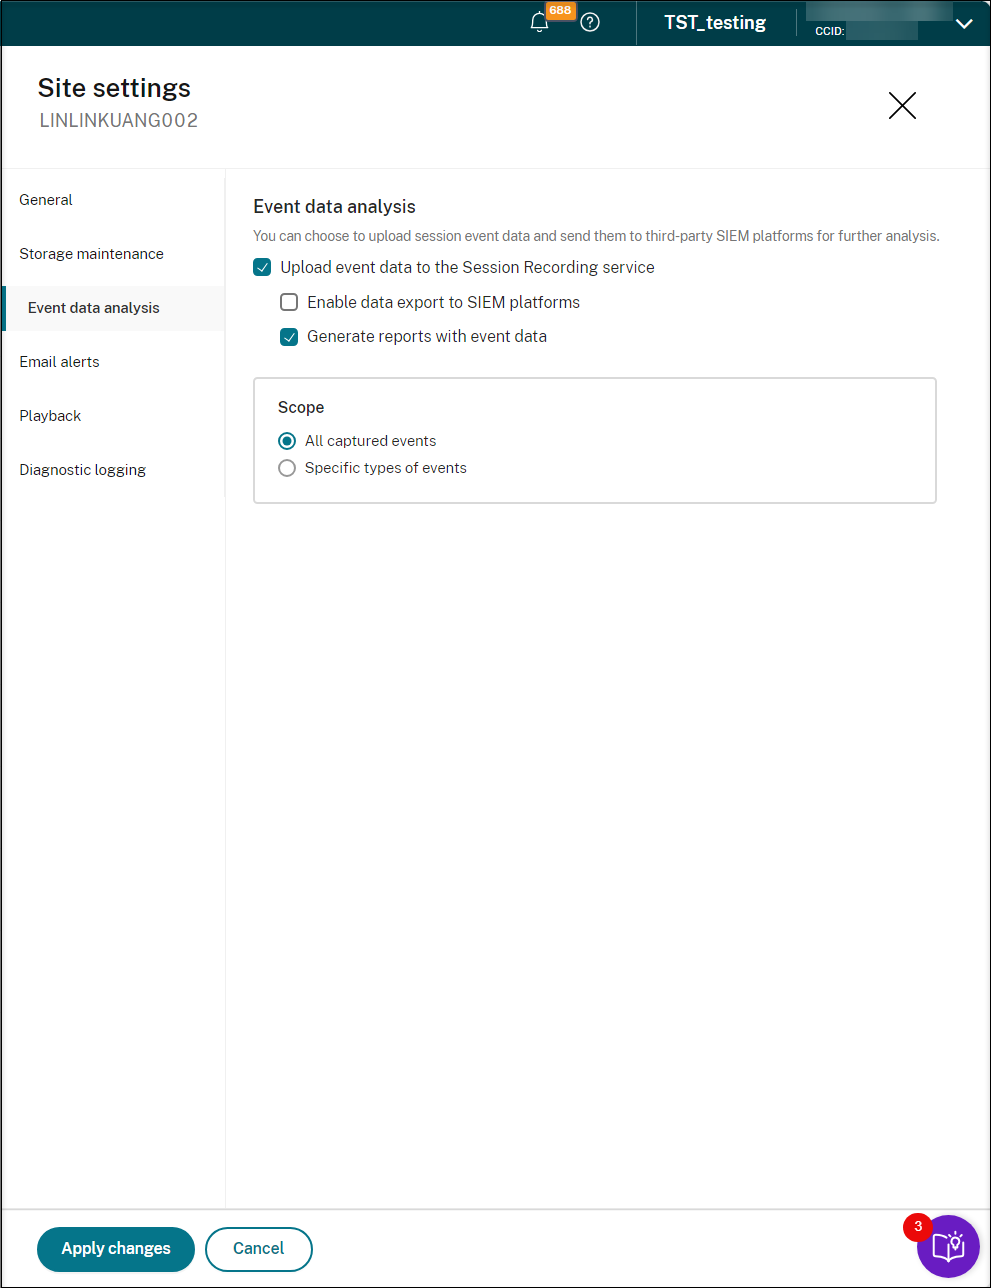
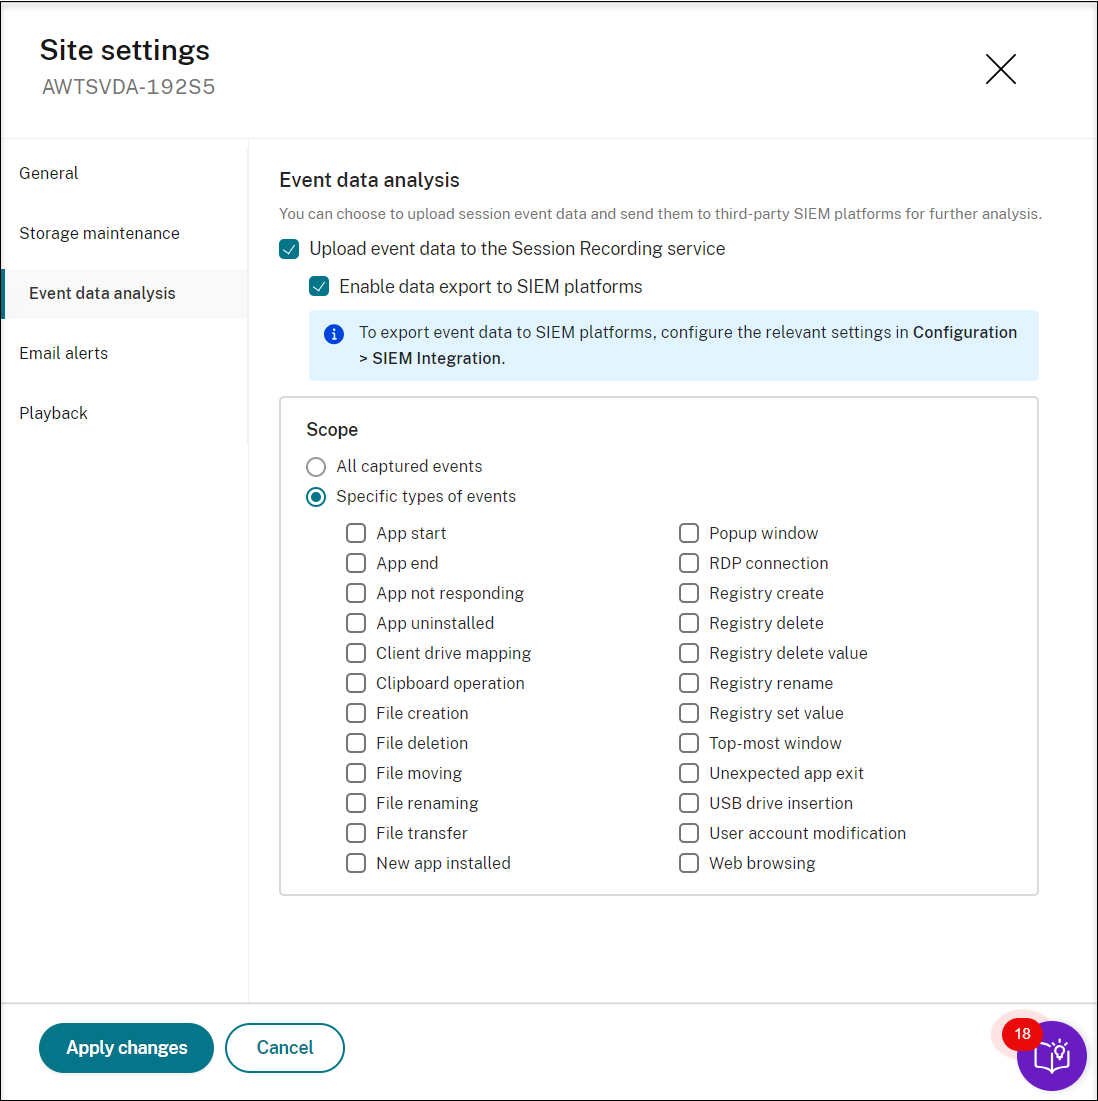
先ほどデータソースとして選択した各サイトのサイト設定に移動します。 次に例を示します:
-
[Upload event data to the Session Recording service]を選択し、次に[Enable data export to SIEM platforms]を選択します。 [Scope]セクションで、転送するイベントの種類を指定します。 次に例を示します:
-
-
統合をテストします。
統合を構成した後、指定されたSIEMプラットフォームにイベントが正しく転送されていることを確認するためにテストします。
-
監視して調整します。
統合が正常に機能していることを確認するために、継続的に監視します。 必要に応じて構成を調整し、イベント転送を微調整してアラートの精度を向上させます。
-
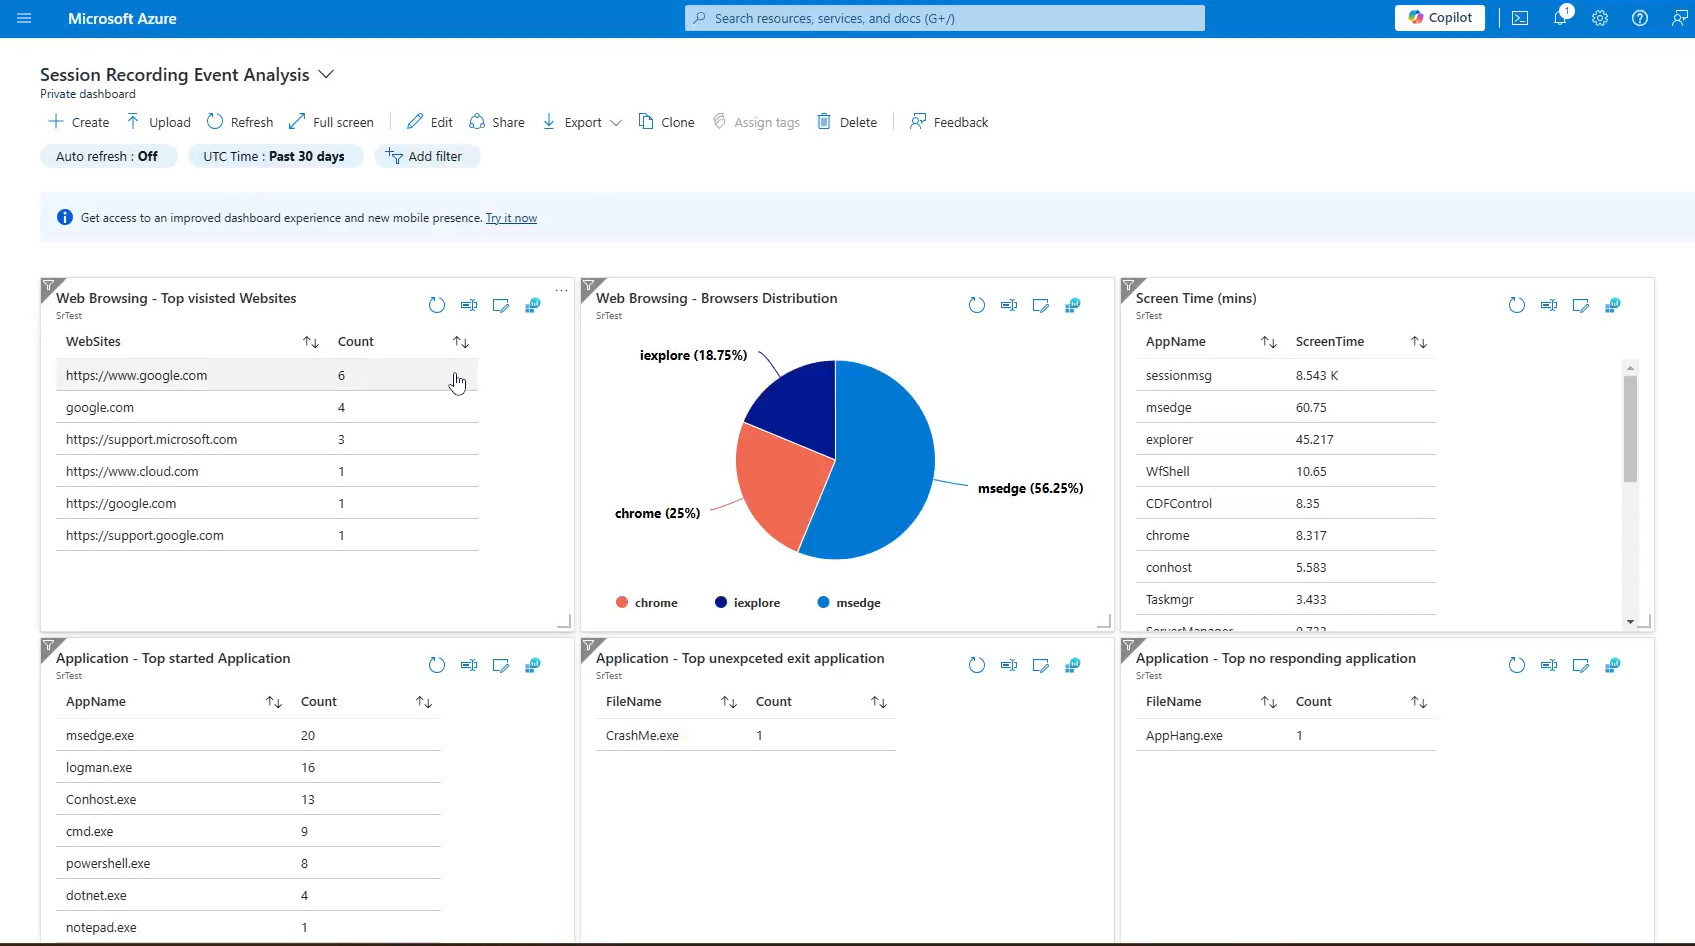
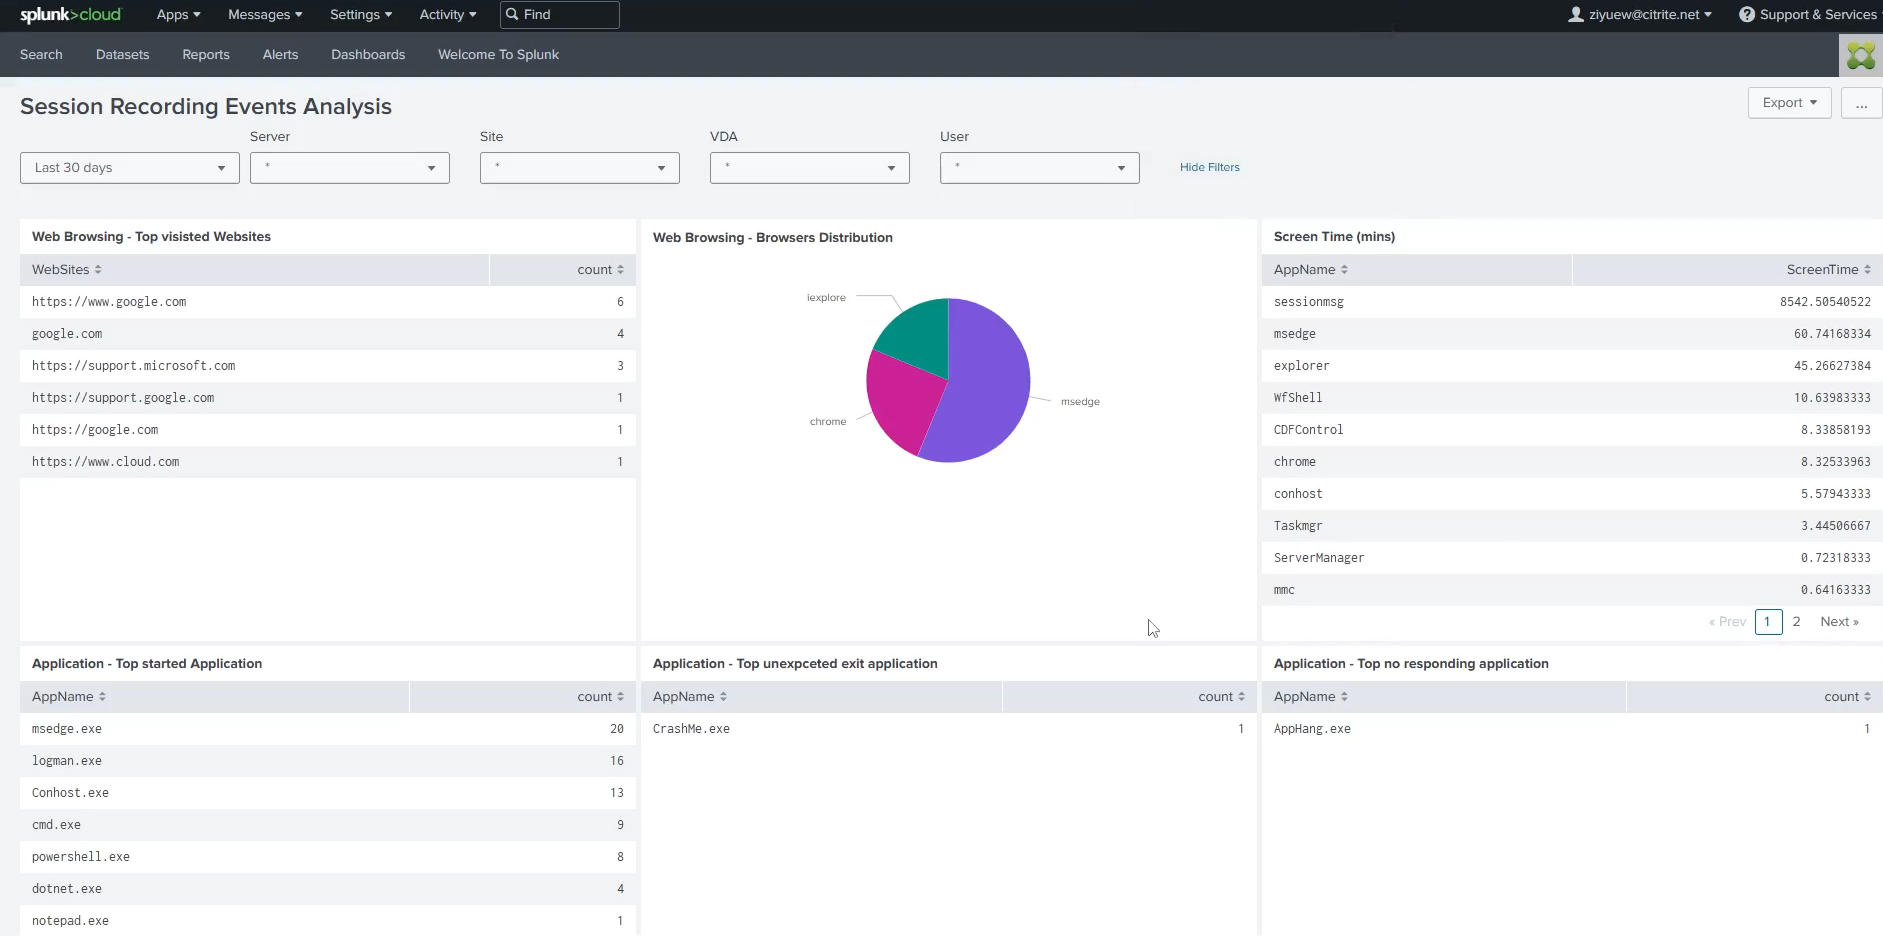
イベントデータを視覚化します。
Microsoft SentinelおよびSplunkでイベントデータを視覚化できます。 以下はビューの例です:
Microsoft Sentinelでイベントデータを視覚化するには、Citrixテクニカルサポートにお問い合わせください。
Splunkでイベントデータをすばやくインポートして視覚化するには、次のダッシュボードテンプレートを使用して、
、、``などの検索クエリと視覚化をデータに合わせてカスタマイズします:<form version="1.1" theme="light"> <label>Session Recording Events Analysis</label> <fieldset submitButton="false"> <input type="time" token="time_field"> <label></label> <default> <earliest>-24h@h</earliest> <latest>now</latest> </default> </input> <input type="dropdown" token="Server"> <label>Server</label> <default>*</default> <initialValue>*</initialValue> <fieldForValue>Server</fieldForValue> <search> <query>index= sourcetype= source= | table dvc | rename dvc as Server | dedup Server | sort Server</query> <earliest>$time_field.earliest$</earliest> <latest>$time_field.latest$</latest> </search> </input> <input type="dropdown" token="Site"> <label>Site</label> <default>*</default> <initialValue>*</initialValue> <fieldForValue>Site</fieldForValue> <search> <query>index="" sourcetype= source= | table tenant.srSiteId | rename tenant.srSiteId as Site | dedup Site | sort Site</query> <earliest>$time_field.earliest$</earliest> <latest>$time_field.latest$</latest> </search> </input> <input type="dropdown" token="VDA"> <label>VDA</label> <default>*</default> <initialValue>*</initialValue> <fieldForValue>VDA</fieldForValue> <search> <query>index= sourcetype= source= | table payload.deviceId | rename payload.deviceId as VDA | dedup VDA | sort VDA</query> <earliest>$time_field.earliest$</earliest> <latest>$time_field.latest$</latest> </search> </input> <input type="dropdown" token="User"> <label>User</label> <default>*</default> <initialValue>*</initialValue> <fieldForValue>User</fieldForValue> <search> <query>index= sourcetype= source= | table payload.user | rename payload.user as User | dedup User | sort User</query> <earliest>$time_field.earliest$</earliest> <latest>$time_field.latest$</latest> </search> </input> </fieldset> <row> <panel> <table> <title>Web Browsing - Top visisted Websites</title> <search> <query>index= sourcetype= source= | search type=Citrix.EventMonitor.WebBrowsing | spath payload.ExtEventData1 | stats count by payload.ExtEventData1 | sort count desc | rename payload.ExtEventData1 as WebSites</query> <earliest>$time_field.earliest$</earliest> <latest>$time_field.latest$</latest> <sampleRatio>1</sampleRatio> </search> <option name="dataOverlayMode">none</option> <option name="drilldown">none</option> <option name="percentagesRow">false</option> <option name="rowNumbers">false</option> <option name="totalsRow">false</option> <option name="wrap">true</option> <format type="color" field="FunctionFailed"> <colorPalette type="list">[#118832,#D41F1F]</colorPalette> <scale type="threshold">1</scale> </format> </table> </panel> <panel> <chart> <title>Web Browsing - Browsers Distribution</title> <search> <query>index= sourcetype= source= | search type=Citrix.EventMonitor.WebBrowsing | spath payload.ExtEventData3 | stats count by payload.ExtEventData3|sort count desc</query> <earliest>$time_field.earliest$</earliest> <latest>$time_field.latest$</latest> <sampleRatio>1</sampleRatio> </search> <option name="charting.chart">pie</option> <option name="charting.drilldown">none</option> <option name="refresh.display">progressbar</option> </chart> </panel> <panel> <table> <title>Screen Time (mins)</title> <search> <query>index= sourcetype= source= | spath "payload.type" | search "payload.type"="Citrix.EventMonitor.TopMost" | rename payload.ExtEventData1 as AppName, payload.deviceId as DeviceId | eval time=strptime(st, "%Y-%m-%dT%H:%M:%S.%7N") | sort DeviceId time | streamstats current=f window=1 last(time) as last_time by DeviceId | eval time_diff = if(isnull(last_time), null(), time - last_time) | table time, DeviceId, AppName, time_diff |eval time_diff = time_diff/60 | stats sum(time_diff) by AppName |sort by sum(time_diff) desc |rename sum(time_diff) as ScreenTime</query> <earliest>$time_field.earliest$</earliest> <latest>$time_field.latest$</latest> <sampleRatio>1</sampleRatio> </search> <option name="dataOverlayMode">none</option> <option name="drilldown">none</option> <option name="percentagesRow">false</option> <option name="refresh.display">progressbar</option> <option name="rowNumbers">false</option> <option name="totalsRow">false</option> <option name="wrap">true</option> <format type="color" field="FunctionFailed"> <colorPalette type="list">[#118832,#D41F1F]</colorPalette> <scale type="threshold">1</scale> </format> </table> </panel> </row> <row> <panel> <table> <title>Application - Top started Application</title> <search> <query>index= sourcetype= source= | search type=Citrix.EventMonitor.AppStart | spath payload.ExtEventData2 | stats count by payload.ExtEventData2 | sort count desc | rename payload.ExtEventData2 as AppName</query> <earliest>$time_field.earliest$</earliest> <latest>$time_field.latest$</latest> <sampleRatio>1</sampleRatio> </search> <option name="dataOverlayMode">none</option> <option name="drilldown">none</option> <option name="percentagesRow">false</option> <option name="rowNumbers">false</option> <option name="totalsRow">false</option> <option name="wrap">true</option> <format type="color" field="FunctionFailed"> <colorPalette type="list">[#118832,#D41F1F]</colorPalette> <scale type="threshold">1</scale> </format> </table> </panel> <panel> <table> <title>Application - Top unexpceted exit application</title> <search> <query>index= sourcetype= source= | search type=Citrix.EventMonitor.UnexpectedAppExit | spath payload.ExtEventData2 | stats count by payload.ExtEventData2 | sort count desc | rename payload.ExtEventData2 as AppPath | eval AppNameSplit = split(AppPath, "\\") | eval AppName = mvindex(AppNameSplit, -1) | table AppName|stats count by AppName</query> <earliest>$time_field.earliest$</earliest> <latest>$time_field.latest$</latest> <sampleRatio>1</sampleRatio> </search> <option name="dataOverlayMode">none</option> <option name="drilldown">none</option> <option name="percentagesRow">false</option> <option name="refresh.display">progressbar</option> <option name="rowNumbers">false</option> <option name="totalsRow">false</option> <option name="wrap">true</option> <format type="color" field="FunctionFailed"> <colorPalette type="list">[#118832,#D41F1F]</colorPalette> <scale type="threshold">1</scale> </format> </table> </panel> <panel> <table> <title>Application - Top no responding application</title> <search> <query>index= sourcetype= source= | search type=Citrix.EventMonitor.AppNotResponding | spath payload.ExtEventData2 | stats count by payload.ExtEventData2 | sort count desc | rename payload.ExtEventData2 as AppPath | eval AppNameSplit = split(AppPath, "\\") | eval AppName = mvindex(AppNameSplit, -1) | table AppName|stats count by AppName</query> <earliest>$time_field.earliest$</earliest> <latest>$time_field.latest$</latest> <sampleRatio>1</sampleRatio> </search> <option name="dataOverlayMode">none</option> <option name="drilldown">none</option> <option name="percentagesRow">false</option> <option name="refresh.display">progressbar</option> <option name="rowNumbers">false</option> <option name="totalsRow">false</option> <option name="wrap">true</option> <format type="color" field="FunctionFailed"> <colorPalette type="list">[#118832,#D41F1F]</colorPalette> <scale type="threshold">1</scale> </format> </table> </panel> </row> <row> <panel> <table> <title>File Transfer - Top transfered in file count</title> <search> <query>index= sourcetype= source=type="Citrix.EventMonitor.FileTransfer" | spath payload.ExtEventData3 | search payload.ExtEventData3 = "Host:*" | rename payload.ExtEventData3 as filePath | eval fileSplit = split(filePath, "\\") | eval FileName = mvindex(fileSplit, -1) | table FileName | stats count by FileName | sort bv count desc</query> <earliest>$time_field.earliest$</earliest> <latest>$time_field.latest$</latest> <sampleRatio>1</sampleRatio> </search> <option name="dataOverlayMode">none</option> <option name="drilldown">none</option> <option name="percentagesRow">false</option> <option name="rowNumbers">false</option> <option name="totalsRow">false</option> <option name="wrap">true</option> <format type="color" field="FunctionFailed"> <colorPalette type="list">[#118832,#D41F1F]</colorPalette> <scale type="threshold">1</scale> </format> </table> </panel> <panel> <table> <title>File Transfer - Top transfered in file size by user</title> <search> <query>index= sourcetype= source=type="Citrix.EventMonitor.FileTransfer" | spath payload.ExtEventData3 | search payload.ExtEventData3 = "Host:*" | rename payload.ExtEventData4 as filesize | eval filesize_mb = case( like(filesize, "% B"), tonumber(replace(filesize, " B", "")) / 1024 /1024, like(filesize, "% KB"), tonumber(replace(filesize, " KB", "")) / 1024, like(filesize, "% MB"), tonumber(replace(filesize, " MB", "")), like(filesize, "% GB"), tonumber(replace(filesize, " GB", "")) * 1024, like(filesize, "% TB"), tonumber(replace(filesize, " TB", "")) * 1024 * 1024 ) | table payload.user, filesize_mb | stats sum by payload.user |rename sum(filesize_mb) as FileSize(MB), payload.user as User</query> <earliest>$time_field.earliest$</earliest> <latest>$time_field.latest$</latest> <sampleRatio>1</sampleRatio> </search> <option name="dataOverlayMode">none</option> <option name="drilldown">none</option> <option name="percentagesRow">false</option> <option name="refresh.display">progressbar</option> <option name="rowNumbers">false</option> <option name="totalsRow">false</option> <option name="wrap">true</option> <format type="color" field="FunctionFailed"> <colorPalette type="list">[#118832,#D41F1F]</colorPalette> <scale type="threshold">1</scale> </format> </table> </panel> <panel> <table> <title>File Transfer - Top transfered out file count by user</title> <search> <query>index= sourcetype= source=type="Citrix.EventMonitor.FileTransfer" | spath payload.ExtEventData2 | search payload.ExtEventData2 = "Host:*" | table payload.user, payload.ExtEventData2 | stats count by payload.user | rename payload.user as User</query> <earliest>$time_field.earliest$</earliest> <latest>$time_field.latest$</latest> <sampleRatio>1</sampleRatio> </search> <option name="dataOverlayMode">none</option> <option name="drilldown">none</option> <option name="percentagesRow">false</option> <option name="rowNumbers">false</option> <option name="totalsRow">false</option> <option name="wrap">true</option> <format type="color" field="FunctionFailed"> <colorPalette type="list">[#118832,#D41F1F]</colorPalette> <scale type="threshold">1</scale> </format> </table> </panel> </row> </form> <!--NeedCopy-->