Enhanced Filters in Sessions View
1. Overview and Key Enhancements
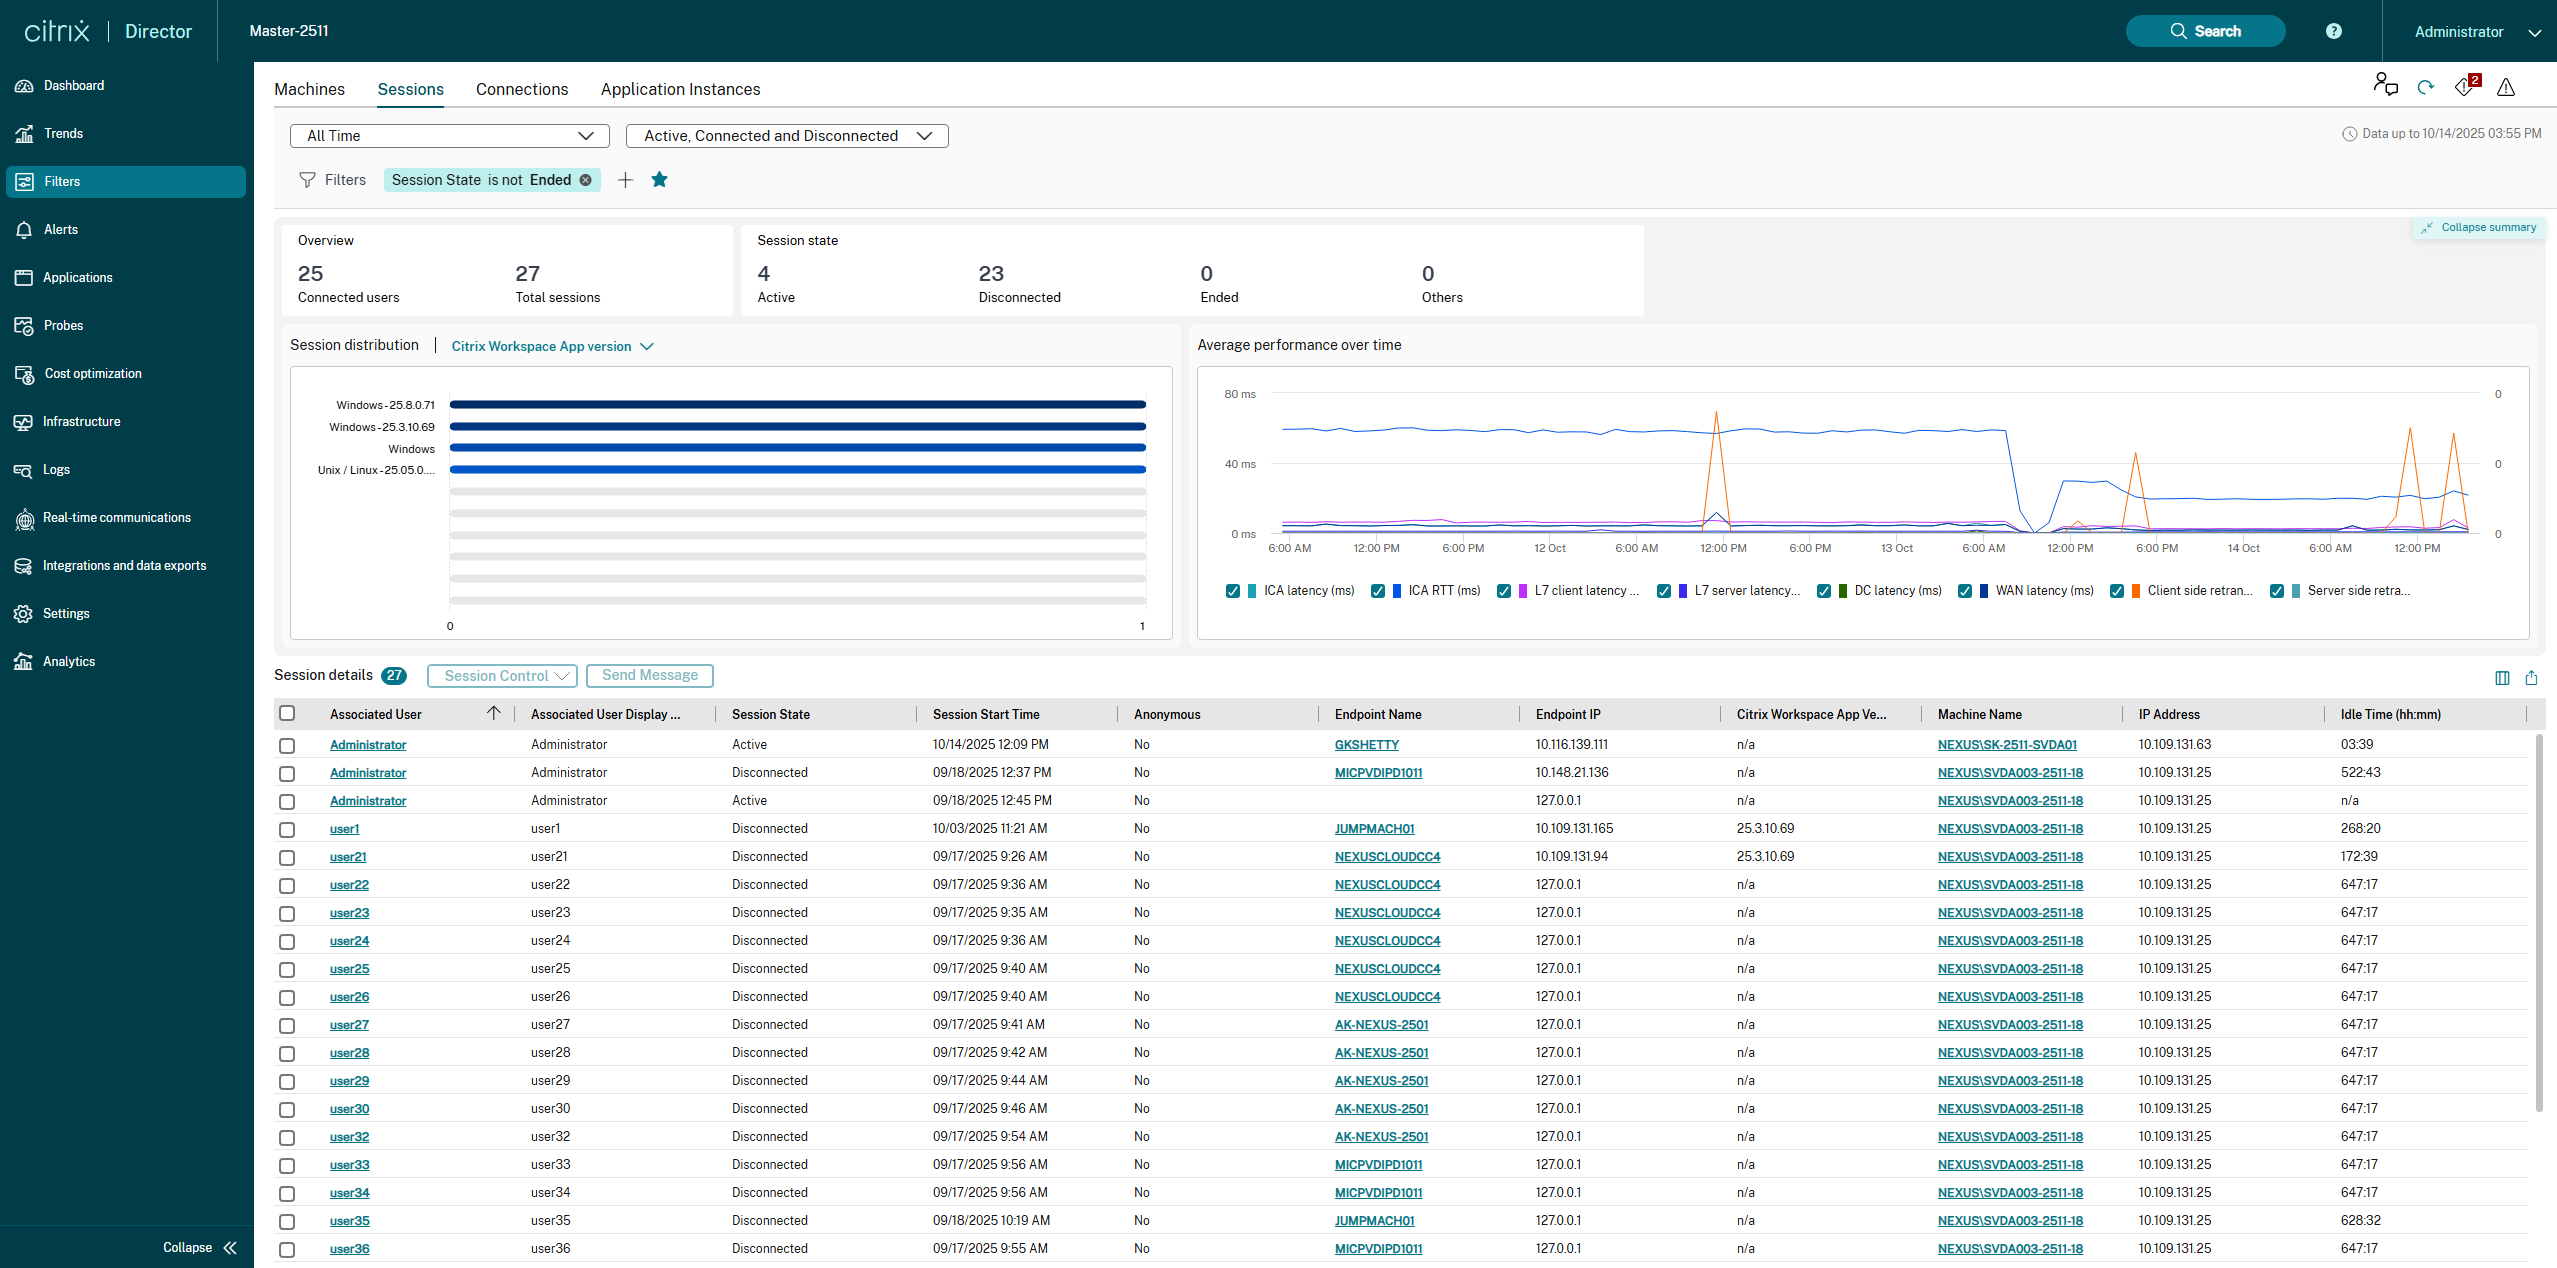
This page details the major updates to the Sessions view, which focuses on real-time and historical user session monitoring.
The key enhancements are:
-
New Time Range Filters: Enhanced monitoring precision with new time range options.
-
Streamlined Filter Management: A new, intuitive dropdown for managing Default and Saved Filters.
-
Intuitive Filter Building: A new, flexible workflow for creating and modifying filters directly on the main page.
-
New Visualizations: Introduction of the Session Distribution chart and Average Performance Over Time chart for immediate insight into session status and performance trends.
2. New Time Range Filters
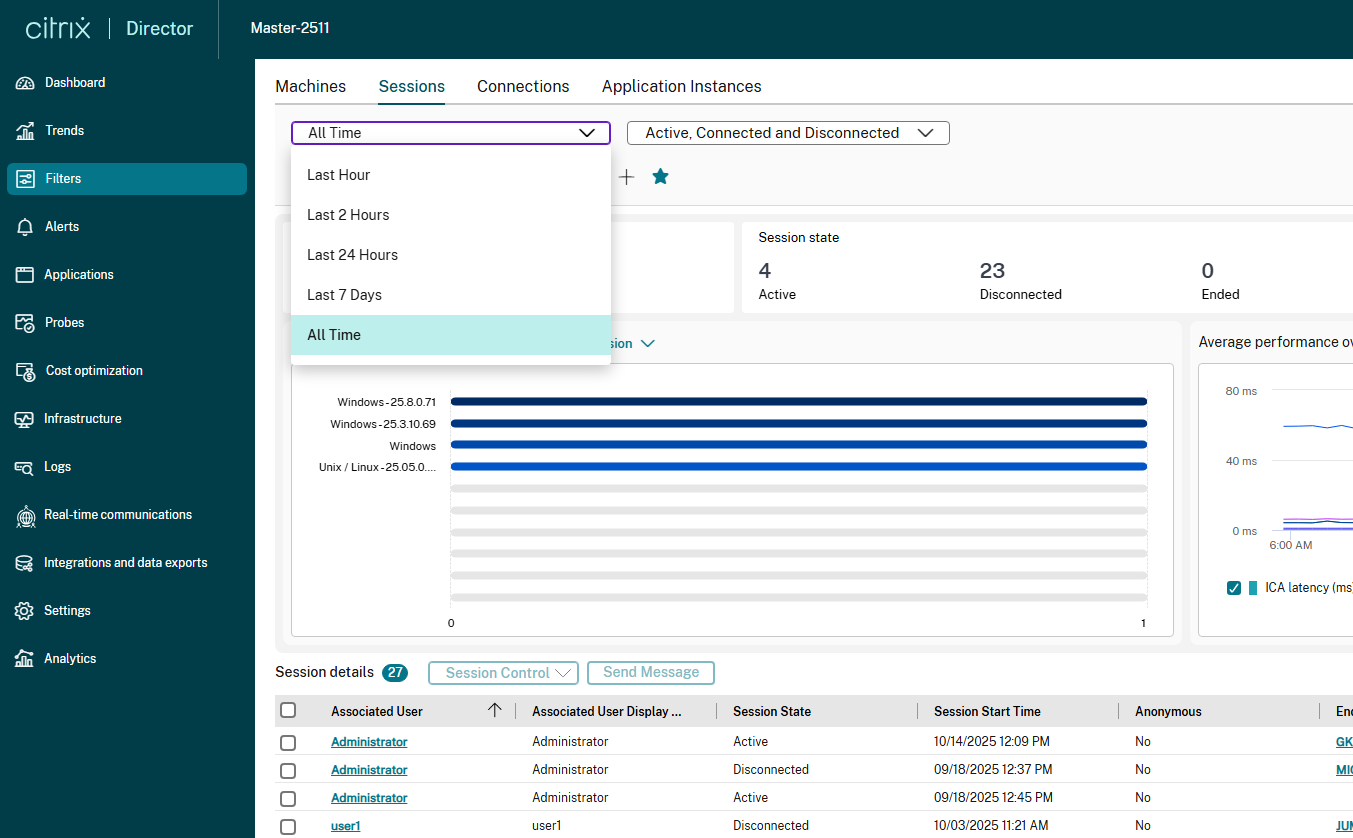
The selected time range determines the data set for the charts and tables. In addition to the existing options, we have introduced new, granular time filters:
| Time Filter | Purpose | Use Case |
|---|---|---|
| Last Hour | Immediate Action. Provides the most recent view of session activity and performance metrics. | Best for real-time monitoring and observing the immediate effect of administrative actions, like restarting a service or applying a policy. |
| Last 2 Hours (New) | Rapid Troubleshooting. Captures data for the recent past to analyze sudden spikes or drops. | Ideal for post-incident analysis, allowing you to pinpoint the exact time an issue (like high latency or low IOPS) started within the last two hours. |
| Last 24 Hours | Daily Overview. Shows a full day’s worth of aggregated performance data. | The default setting for daily operational checks, helping to identify peak usage times and resource contention throughout a business cycle. |
| Last 7 Days (New) | Weekly Trend Analysis. Provides a broader, continuous view of session behavior over a week. | Essential for capacity planning, identifying recurring weekly bottlenecks, and assessing the overall stability of the environment. |
| All Time | Active Status Check. Shows all sessions that are currently connected, active, or disconnected (i.e., not ended), irrespective of their start date. | Essential for getting a complete count of running sessions in the environment right now. |
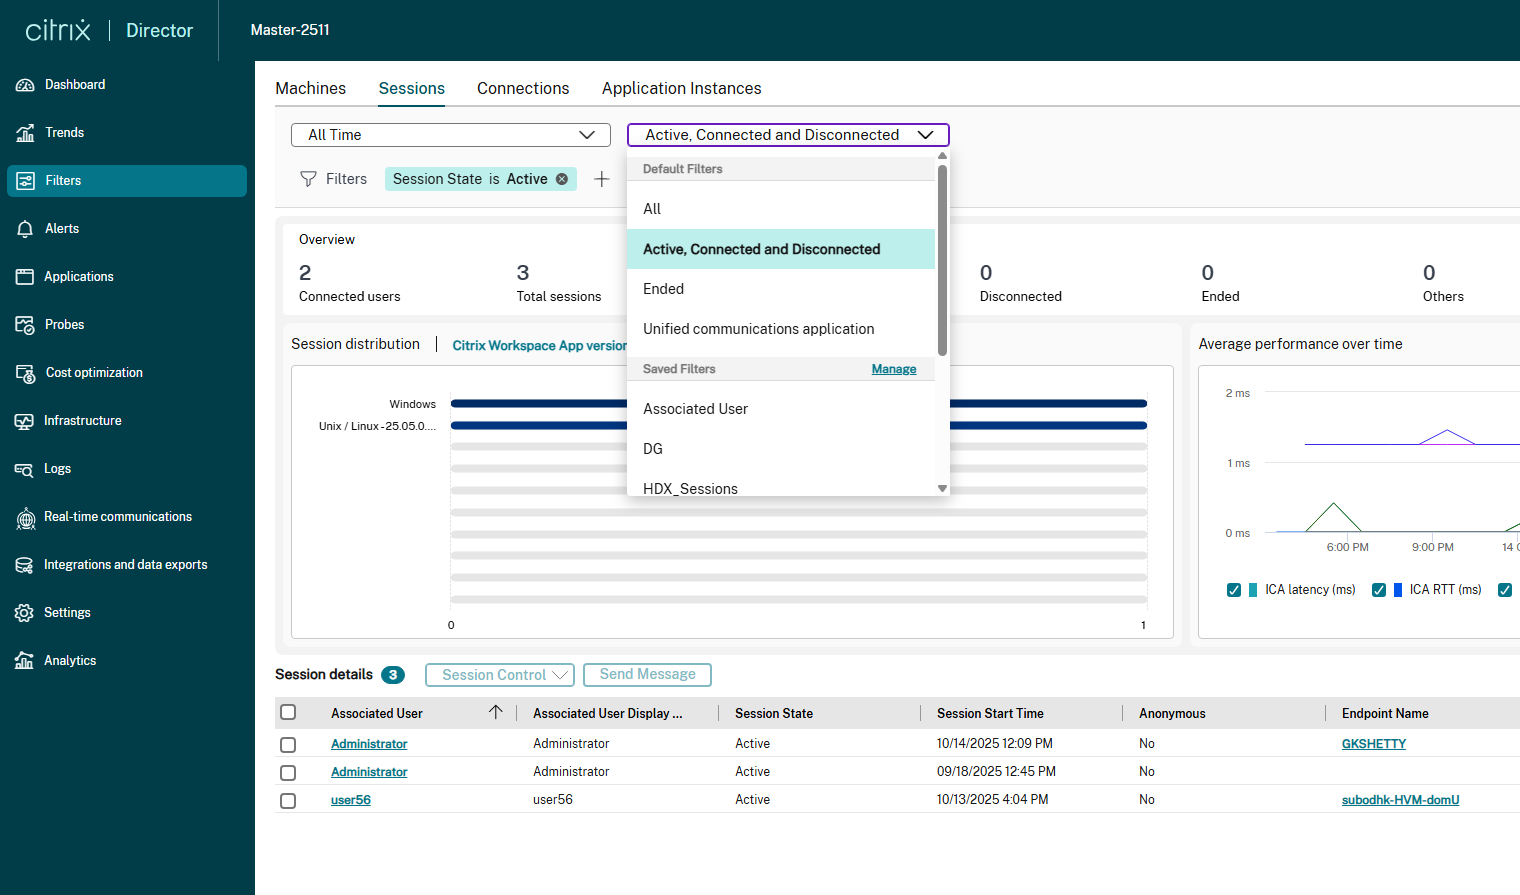
3. New Filter Management Experience
The process for selecting, creating, and modifying filters has been streamlined and moved directly above the data tables.
3.1. Accessing Filters
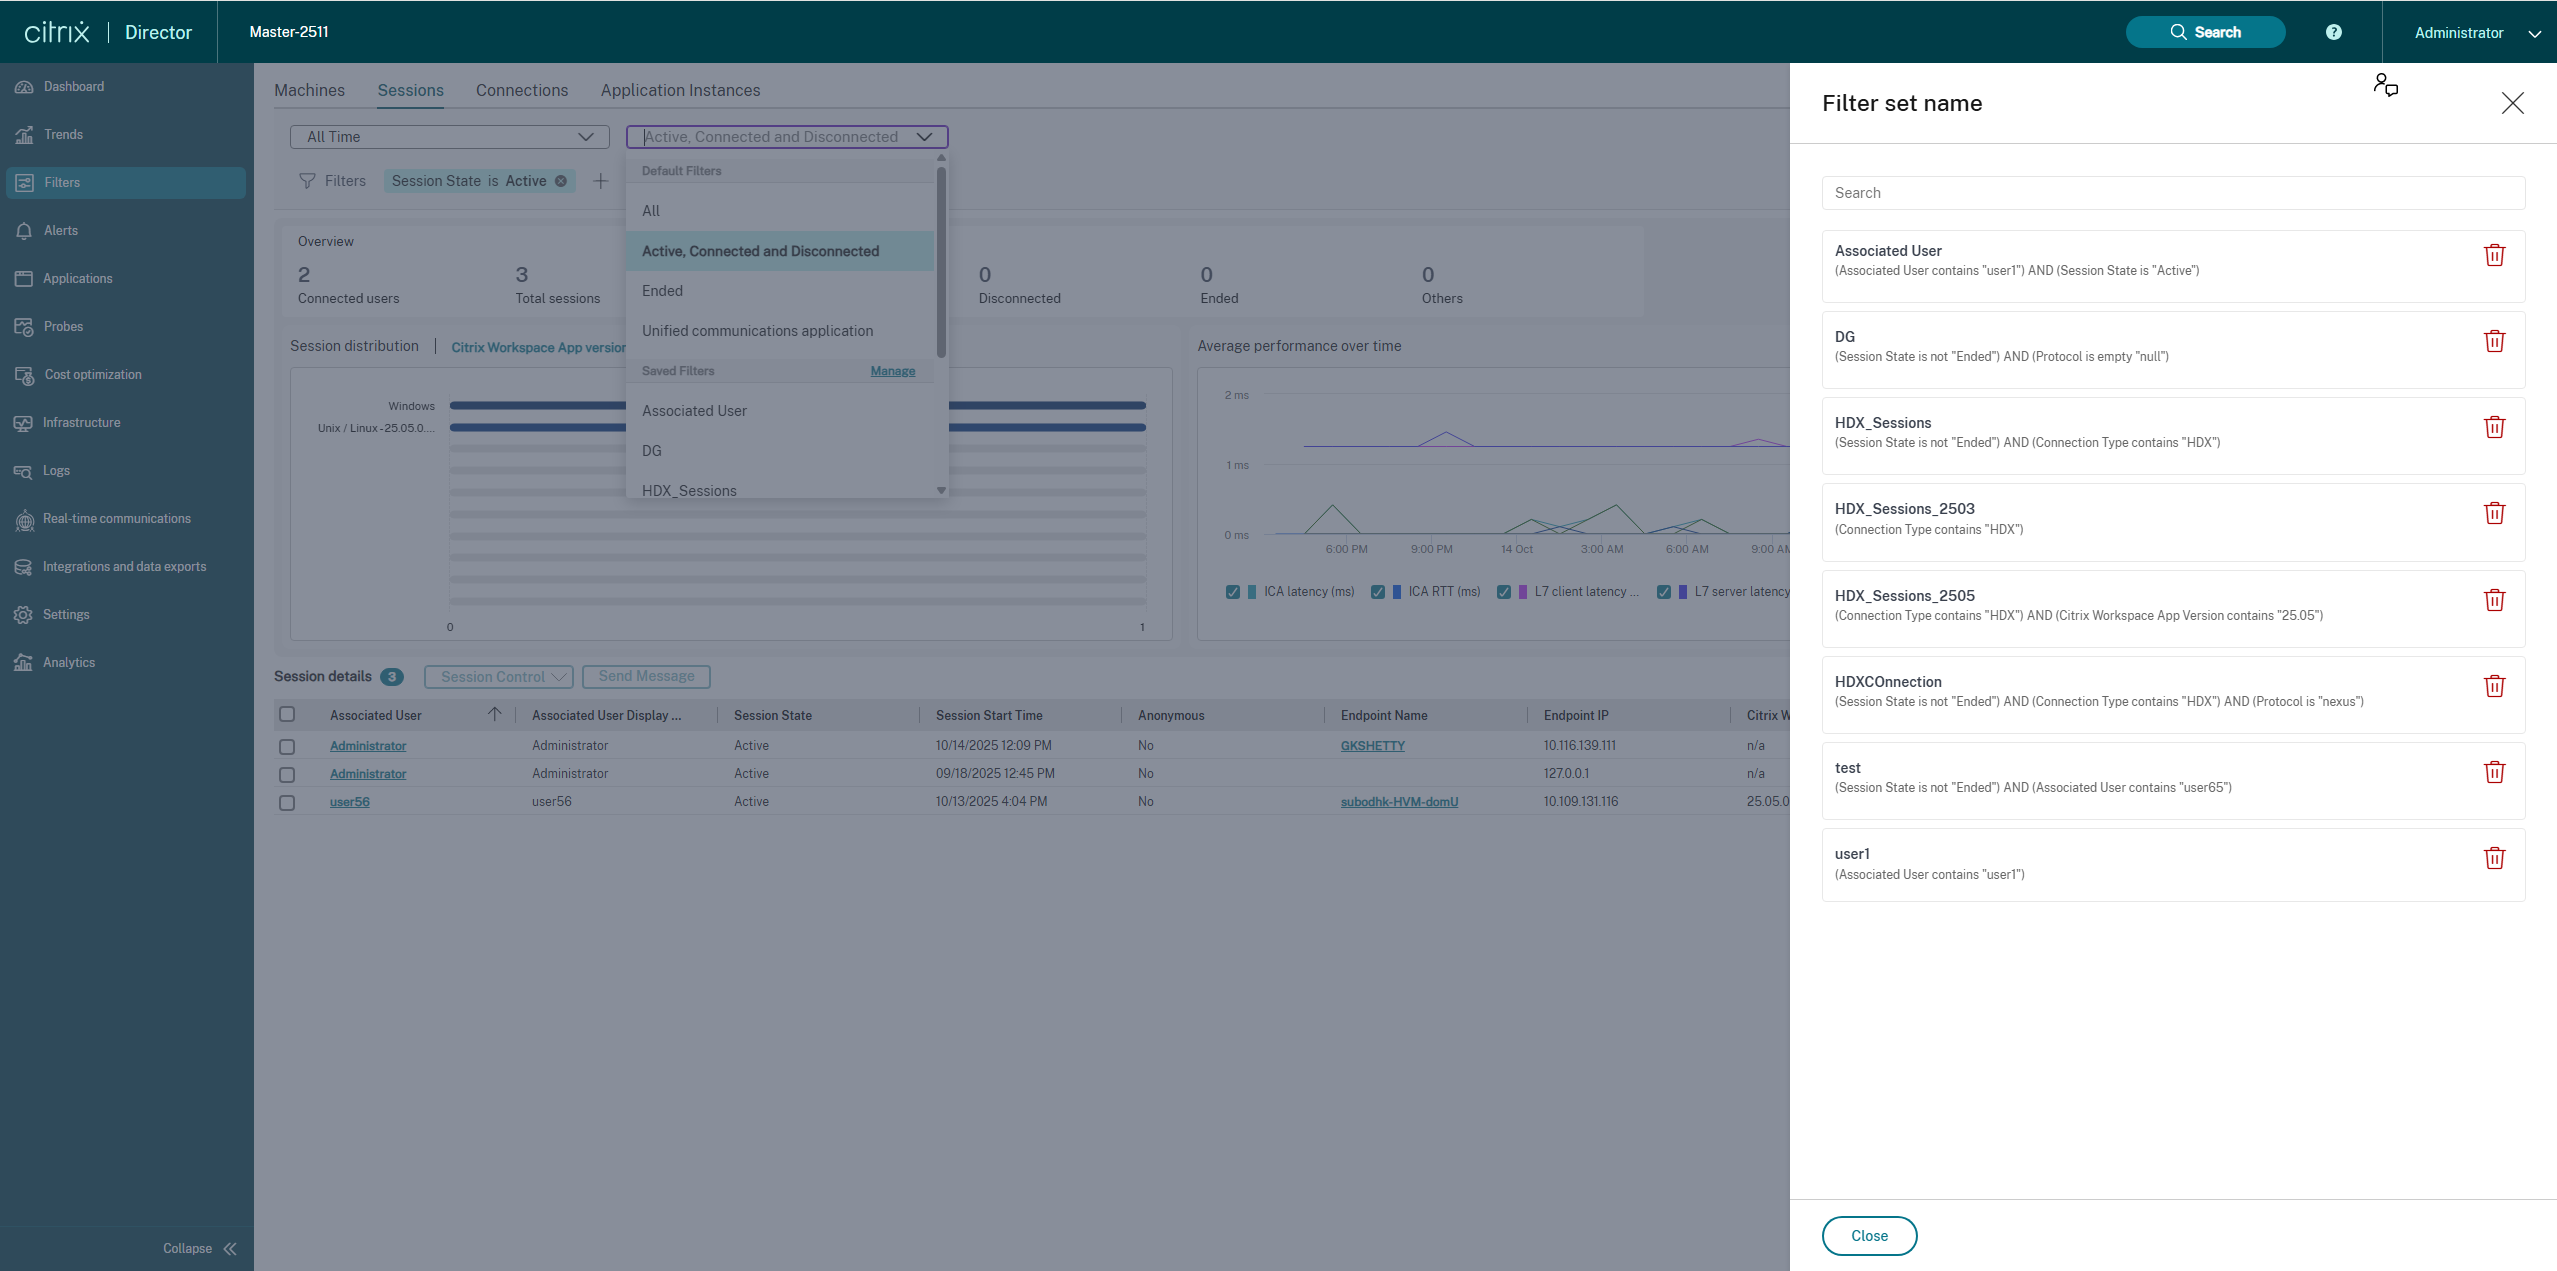
The filter management panel has moved from a side tab into a central dropdown:
-
Default Filters: Contains standard, out-of-the-box filters (e.g., Active, Connected and Disconnected).
-
Saved Filters: Lists all custom filter sets that are created by the administrators.
-
Manage: Clicking Manage opens a side panel where you can search for, view, or delete existing saved filters.
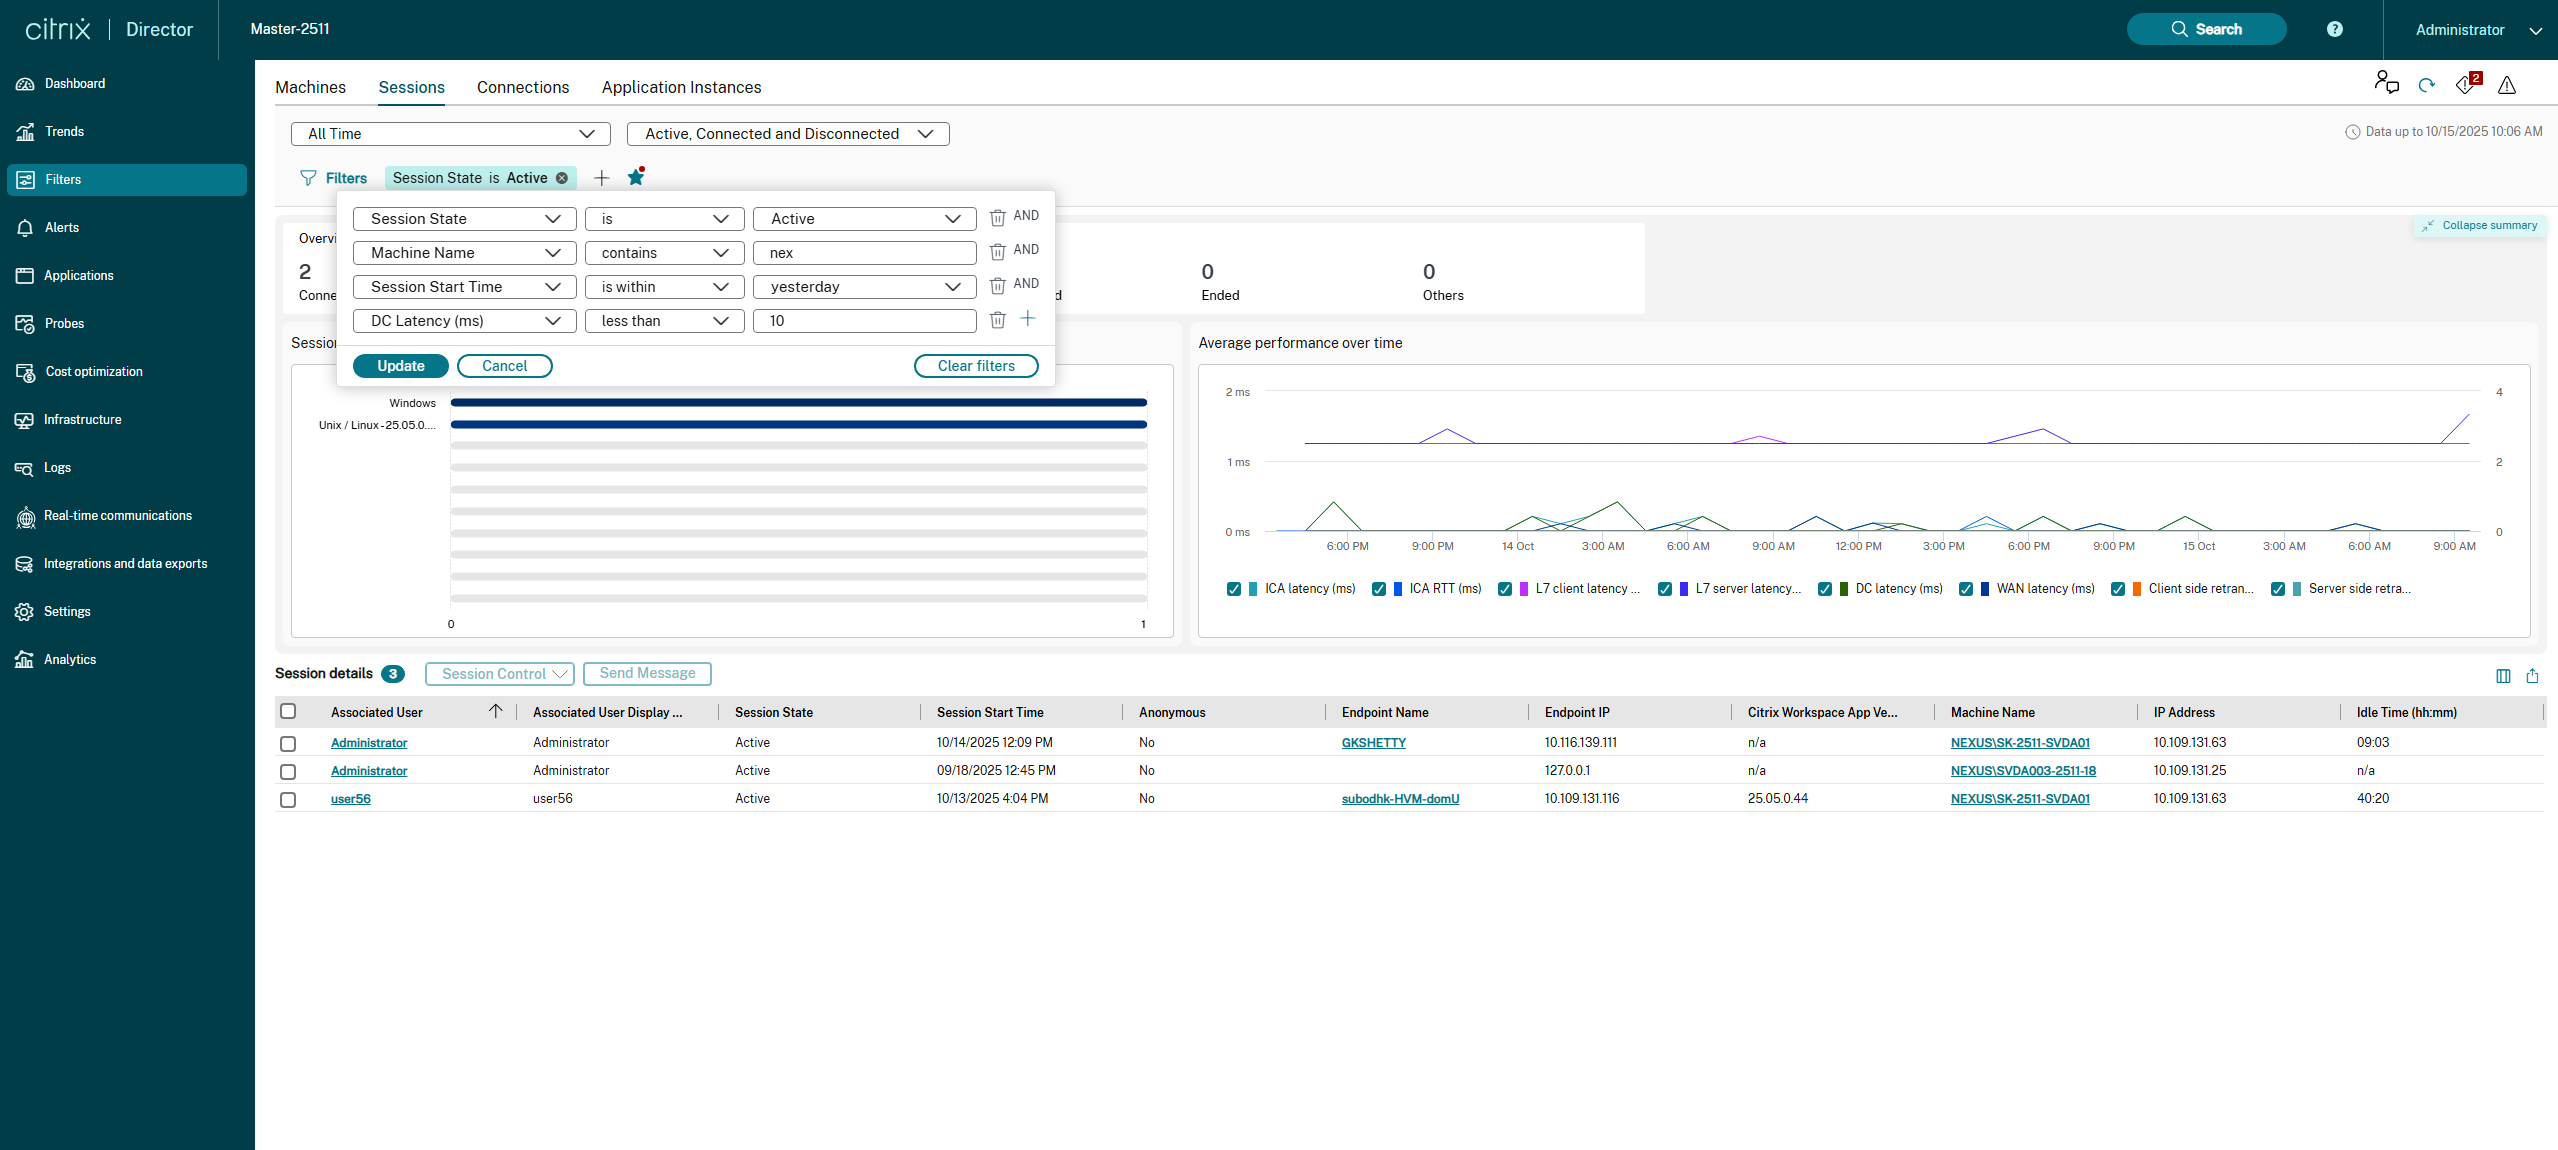
3.2. Building and Applying Filters
You can now build complex filter sets directly on the session overview page:
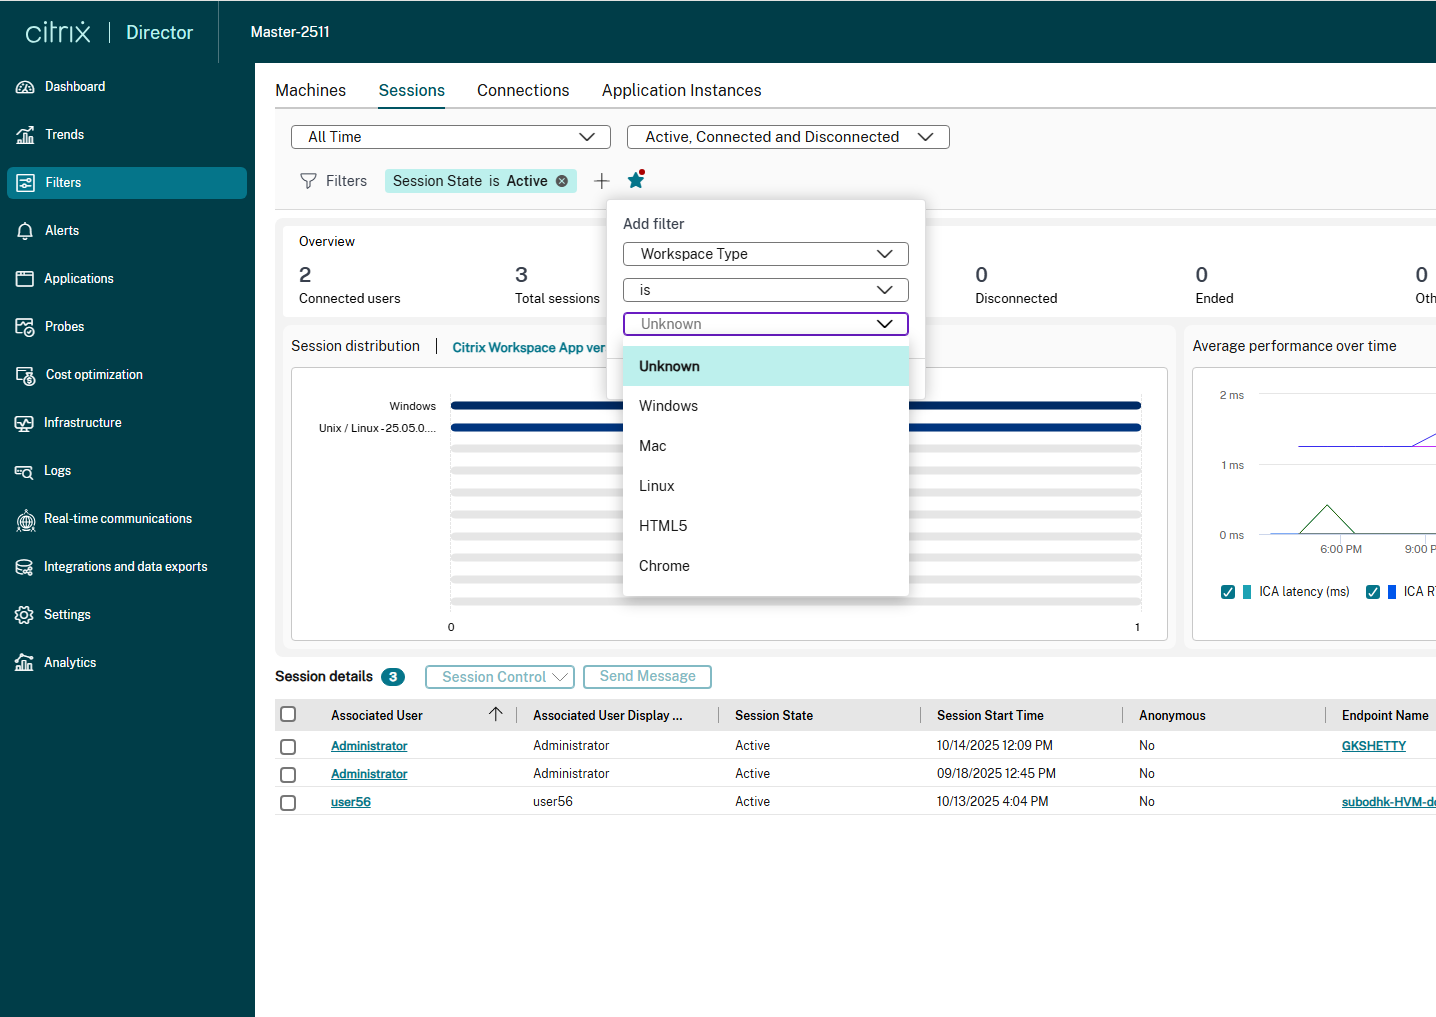
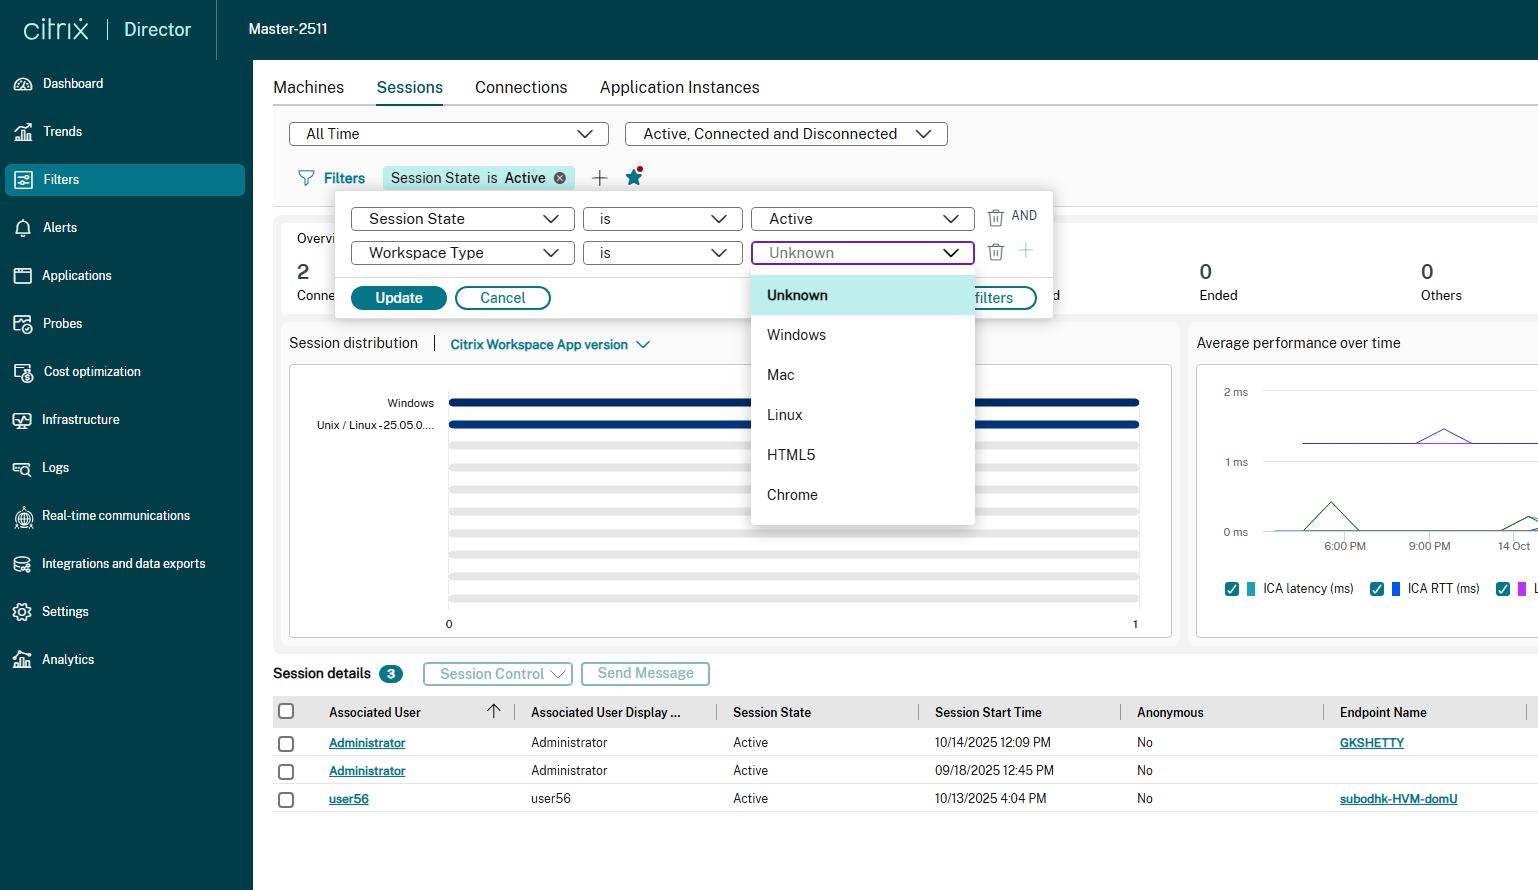
- Click the Filters icon or the + button next to an existing filter.
Select the criteria (e.g., Workspace Type), the operator (e.g., is), and the value (e.g., Windows, Mac, Linux, HTML5, Chrome, Unknown).
3.3. Filter Save Status and Workflow
The star icon (⋆) next to the active filters visually indicates the status of your current filter set. This helps to guide admins for saving, applying, and managing custom filters.
| Filter Status | Icon Appearance | Meaning | Required Action |
|---|---|---|---|
|
Unsaved Filter
|
 |
The current combination of filter criteria has not been saved.
|
Click the empty star to open the dialog box, name the filter set, and save it.
|
| (Empty outline with a Red Dot) | |||
| Saved Filter
|
 |
The currently active filter set is an exact match to a previously saved filter.
|
No action required. You are viewing data based on a defined template.
|
| (Filled / Solid) | |||
| Saved Filter with Changes
|
 |
When using a saved filter, any other filter is added, removed, or if any column is sorted then the red dot appears which means the changes are not yet saved.
|
Click the red-dotted star to update the existing saved filter, or use the dropdown to select Save as filter set to create a new one.
|
| (Filled with Red Dot) | |||
| Default Filter | |||
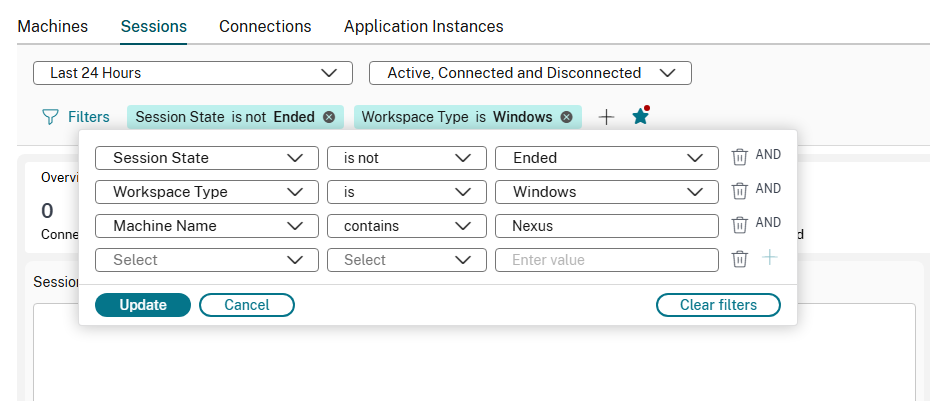
| (Not an icon, but a state) | By default, Session State is not Ended filter criteria is applied. | Click Update to apply changes made, or Cancel to revert, or Click on  Icon to completely remove the default filter. Icon to completely remove the default filter. |
3.4. Filter Action Buttons
When adding new filters or modifying a saved filter, the following controls and status indicators become available:
| Button | Meaning and Action |
|---|---|
| Update | Applies all currently active filter criteria to the charts and the application performance data table. |
| Cancel | Discards any changes made to the current filter set and reverts to the last applied filter. |
| Clear filters | Removes all the newly added filter criteria. |
|
Icon
|
Removes the selected filter criteria on which this icon is clicked. |
4. New Visualizations: Session Analysis
Two new charts have been added to provide immediate, graphical insights into session behavior and performance.
4.1. Summary Panel

-
Overview: Displays the total number of Connected users and Total Sessions associated with them.
-
Session State: Displays the number of sessions based on their states -Active, Disconnected, Ended and Others.
This summary is collapsible and helps admins to take neccessary actions based on the above seggreation like knowing the long running sessions and end them if needed or to identify any network outage based on disconnected sessions.
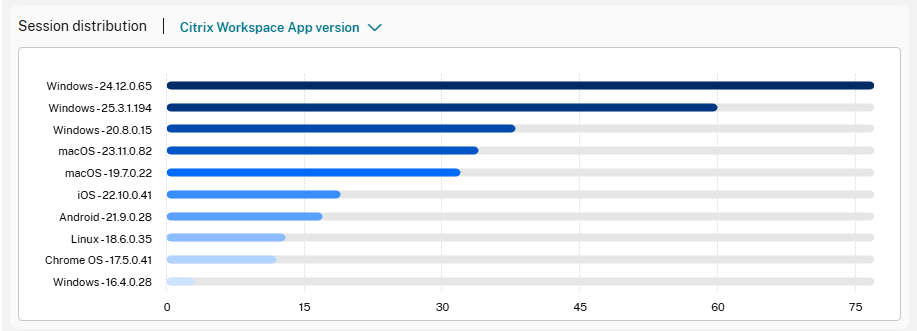
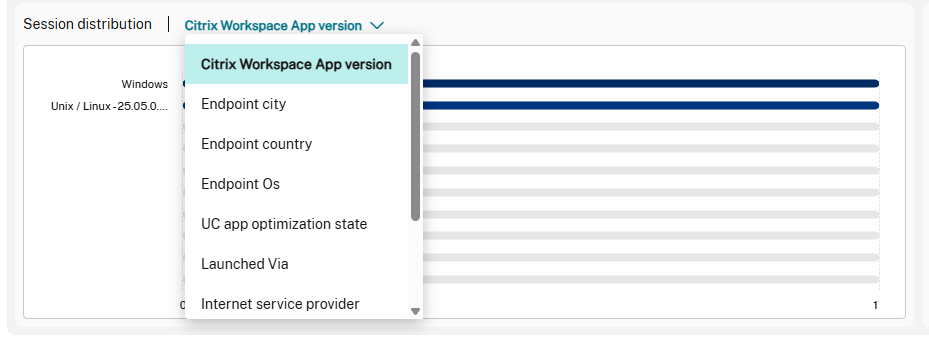
4.2. Session Distribution
-
Purpose: This chart breaks down the currently filtered sessions by a selected categorical metric, defaulting to Citrix Workspace App version.
-
Utility: Helps administrators quickly identify session trends based on user environment, client versions, and connection settings. For example, filtering by Workspace Type can reveal how many users are connecting via Mac vs. Windows or the HTML5 client.
-
Filter Types Supported: The distribution can be segmented by:
- Citrix Workspace App Version
- Endpoint city
- Endpoint country
- UC app optimization State
- Launched via
- Internet service provider
- Machine Name
- Protocol
- Workspace Type
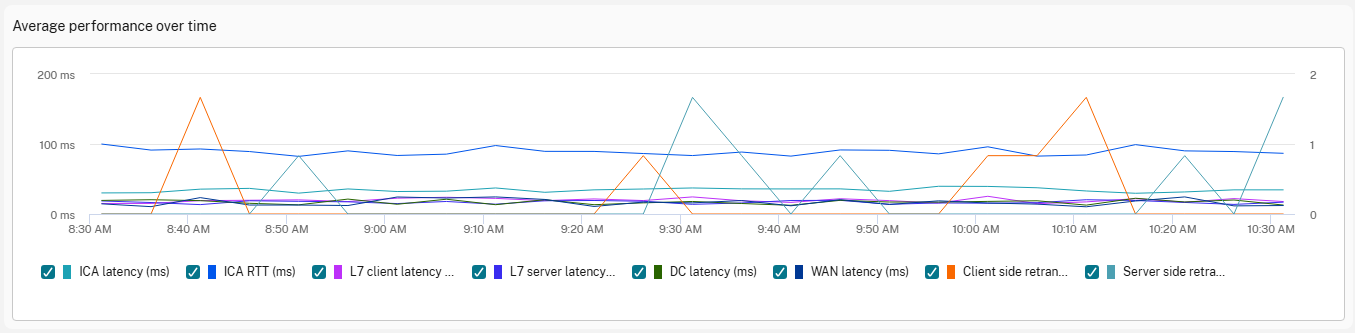
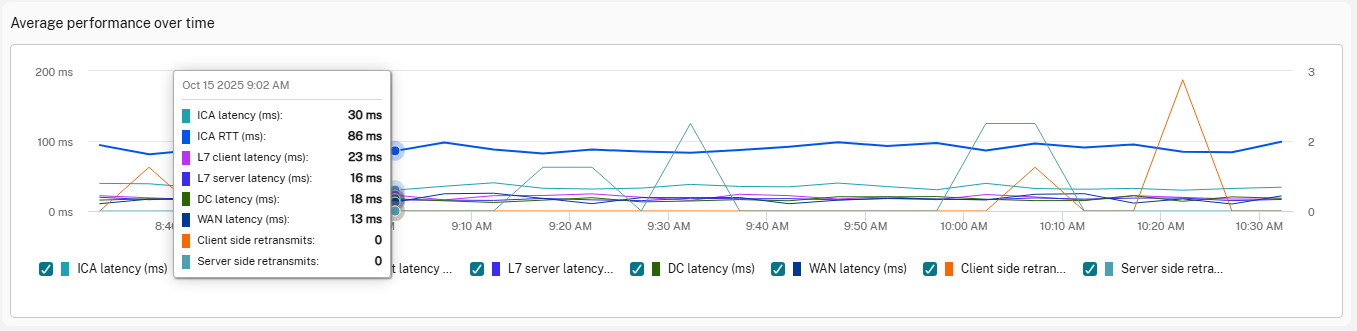
4.3. Average Performance Over Time
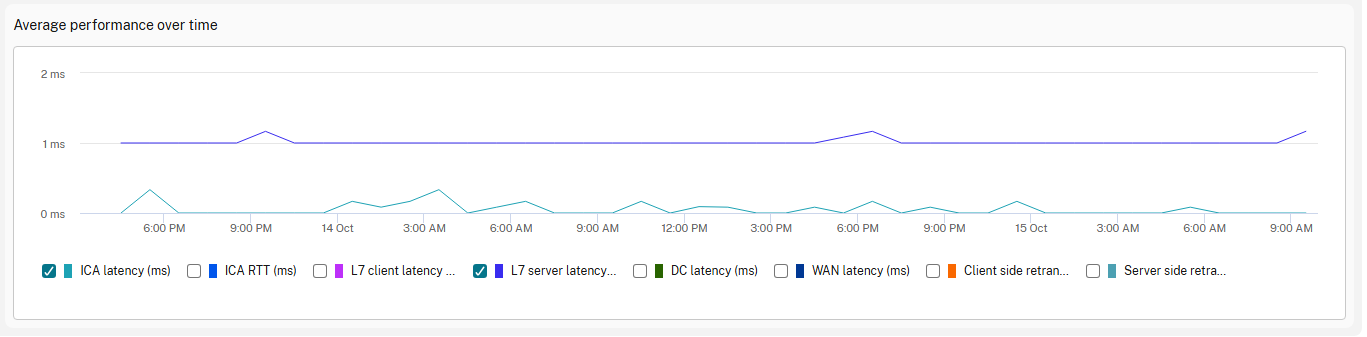
-
Purpose: Tracks key session performance metrics for the sessions included in the current filter and time range.
-
Key Metrics Tracked: This chart focuses on metrics critical to the user experience:
- ICA latency (ms)
- ICA RTT (ms)
- L7 client latency (ms)
- L7 server latency (ms)
- DC latency (ms)
- WAN latency (ms)
- Client side retransmission
- Server side retransmission
-
Utility: Essential for quickly correlating user complaints with historical performance data. Any upward spike in latency or retransmissions in this chart indicates a potential network or VDA performance issue affecting the user experience.