-
-
How to install and use JetBrains IntelliJ Gateway as a Citrix published application
-
Use Citrix Secure Access and Citrix Secure Developer Spaces with VS Code
-
Configure AI Gateway routing in Citrix Secure Developer Spaces
-
Configure external MongoDB with X.509 authentication in Citrix Secure Developer Spaces
-
-
-
Container Process Metrics
This content has been machine translated dynamically.
Dieser Inhalt ist eine maschinelle Übersetzung, die dynamisch erstellt wurde. (Haftungsausschluss)
Cet article a été traduit automatiquement de manière dynamique. (Clause de non responsabilité)
Este artículo lo ha traducido una máquina de forma dinámica. (Aviso legal)
此内容已经过机器动态翻译。 放弃
このコンテンツは動的に機械翻訳されています。免責事項
이 콘텐츠는 동적으로 기계 번역되었습니다. 책임 부인
Este texto foi traduzido automaticamente. (Aviso legal)
Questo contenuto è stato tradotto dinamicamente con traduzione automatica.(Esclusione di responsabilità))
This article has been machine translated.
Dieser Artikel wurde maschinell übersetzt. (Haftungsausschluss)
Ce article a été traduit automatiquement. (Clause de non responsabilité)
Este artículo ha sido traducido automáticamente. (Aviso legal)
この記事は機械翻訳されています.免責事項
이 기사는 기계 번역되었습니다.책임 부인
Este artigo foi traduzido automaticamente.(Aviso legal)
这篇文章已经过机器翻译.放弃
Questo articolo è stato tradotto automaticamente.(Esclusione di responsabilità))
Translation failed!
Container Process Metrics
The section Container Process displays time metrics registered using the platform Command Line Interface (CLI) strongcli available in developers workspaces. Metrics are registered using the ‘time’ option and become available in the Insight dashboard’s section Container Process. This CLI is typically used in scripts embedded in the project containers such that, at startup a selection of processes can be registered for performance assessment. Once registered in a fleet of workspaces, metrics are aggregated and eventually displayed in the Insights page.
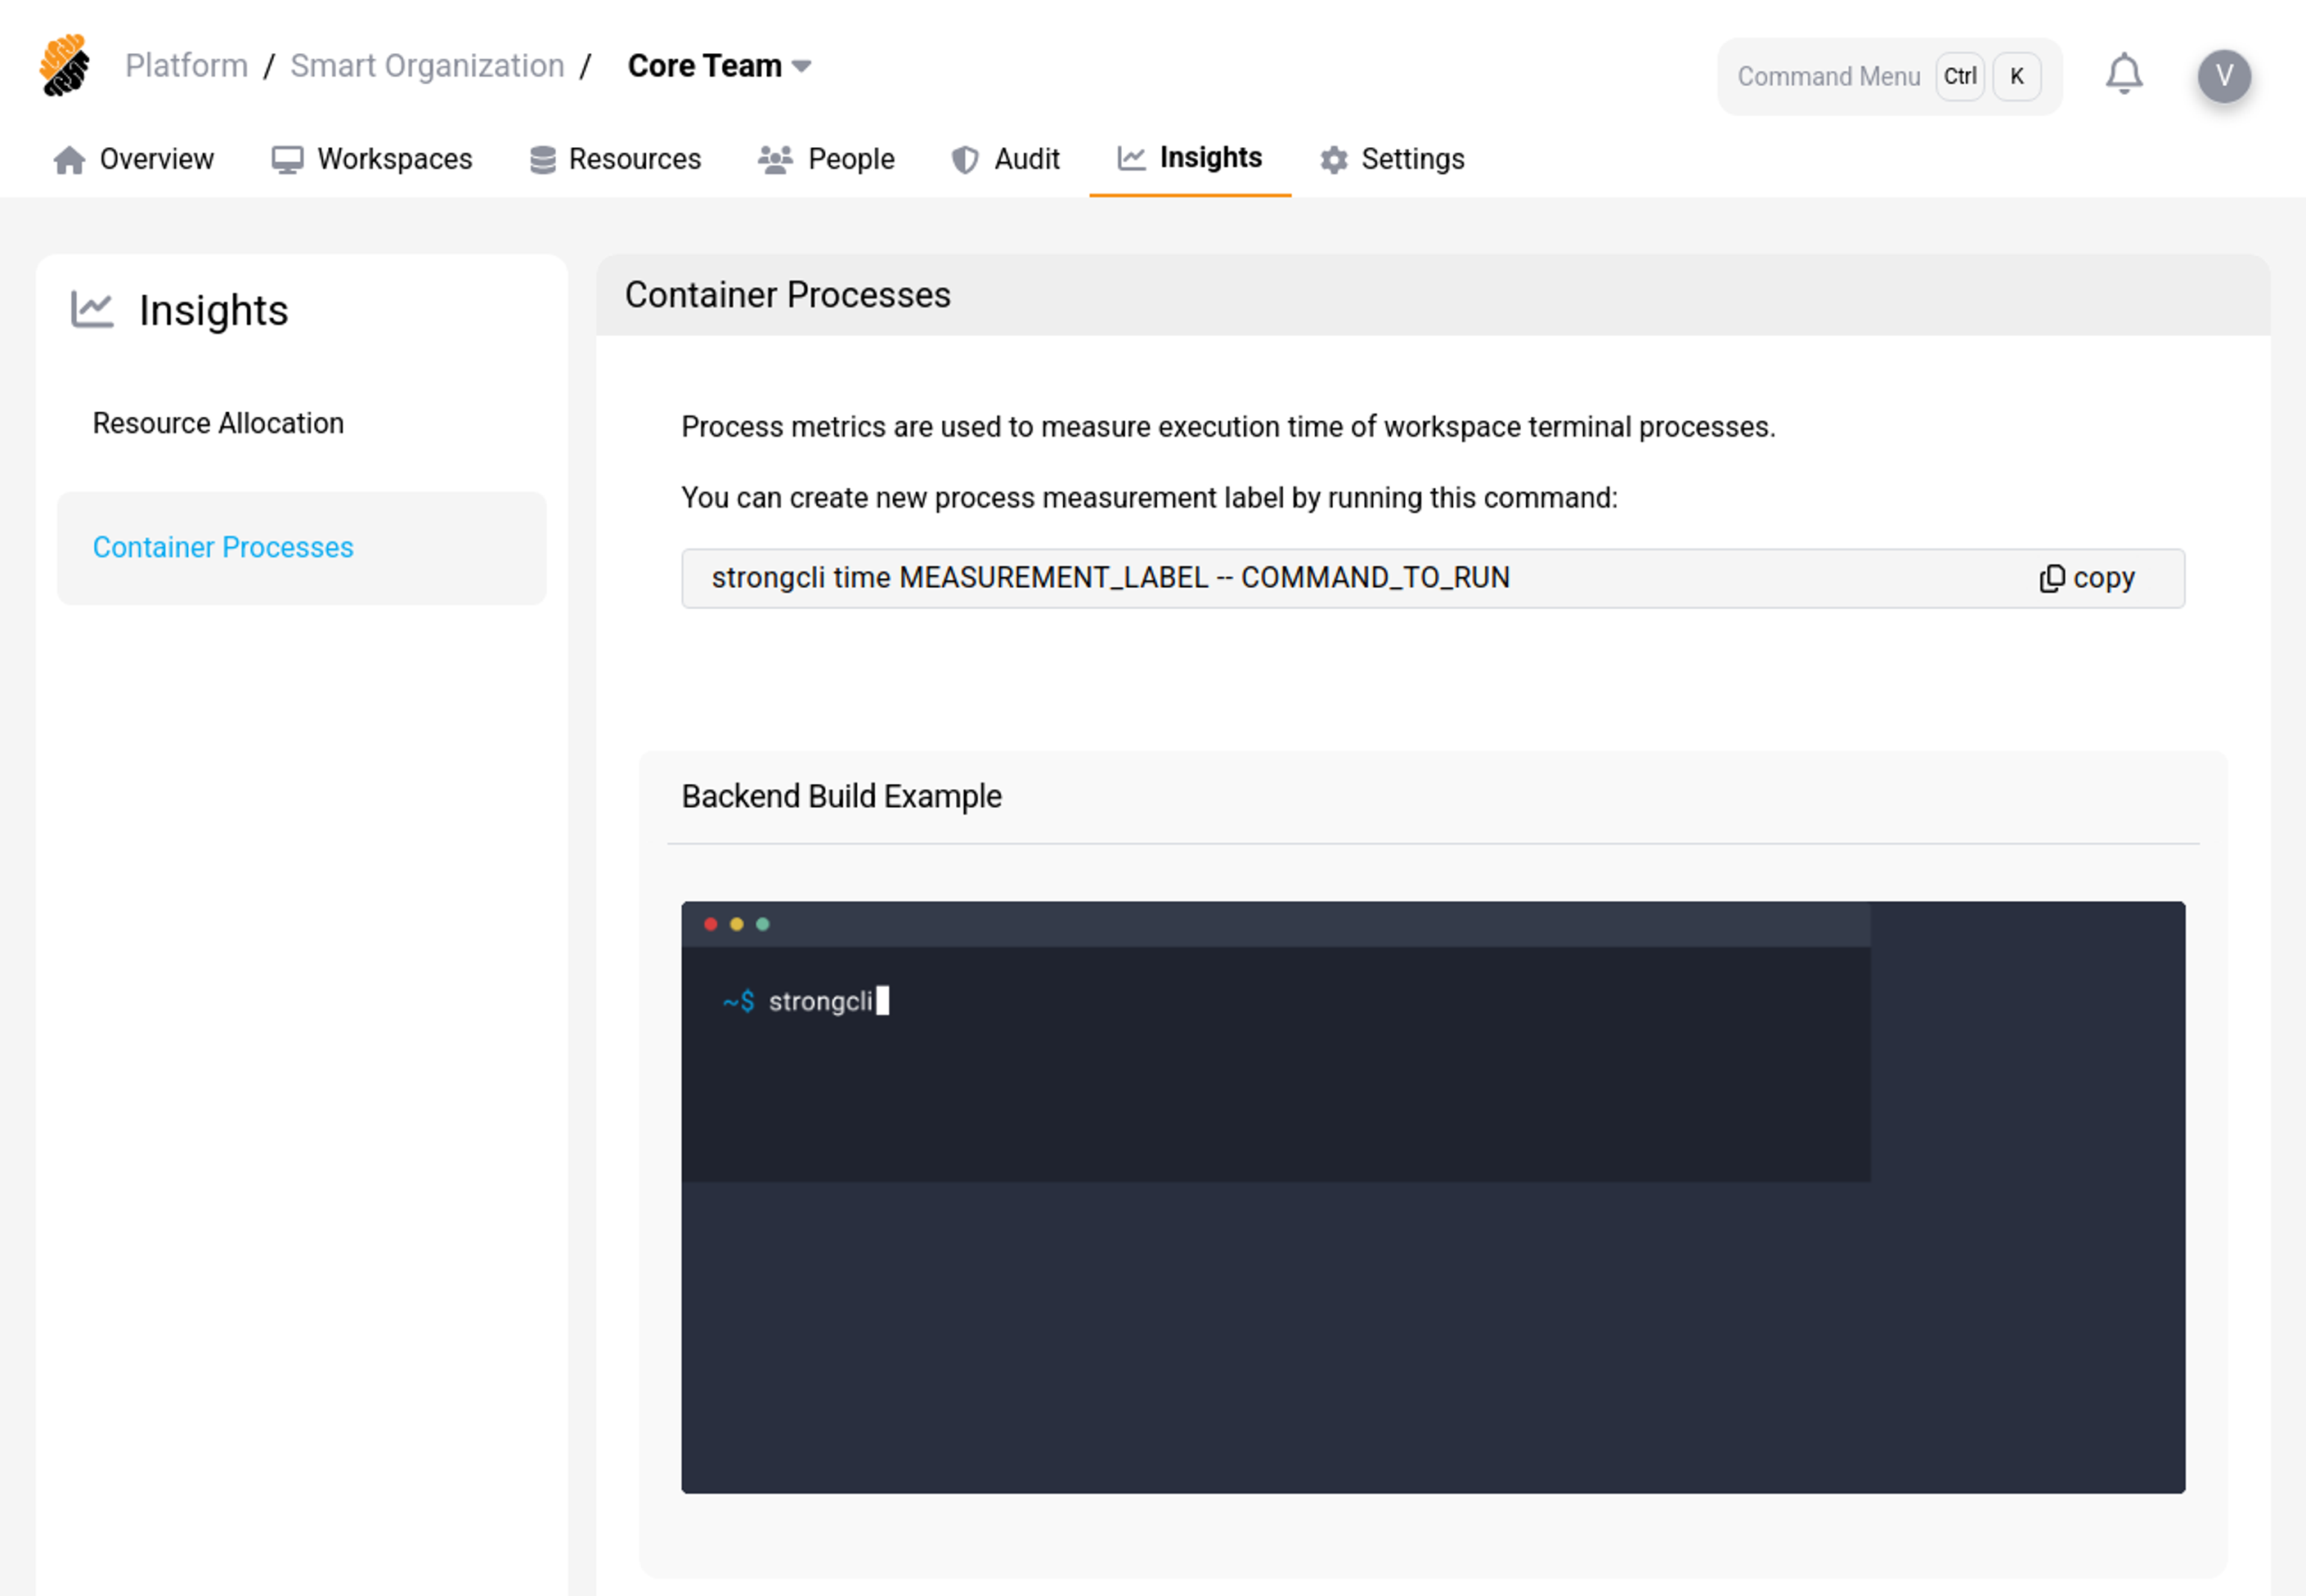
Track a Container Process
You can track the execution time of container processes in workspaces using the platform’s Command Line Interface (CLI) strongcli. Use the following command to do so:
> strongcli time LABEL -- COMMAND_TO_RUN
<!--NeedCopy-->
Where:
- LABEL: This allows setting a label to identify the process in the Insight dashboard,
- COMMAND_TO_RUN: The terminal command for which you would like to measure the execution time.
This registers a new process for your workspace among the container processes and measures its execution time.
Insights’ Period
After selecting a container process, you can vary the span of the statistics from a 7-day execution average to a yearly average.
- Click on the drop-down menu to the right of “Last 7 days” to change the evaluation period.
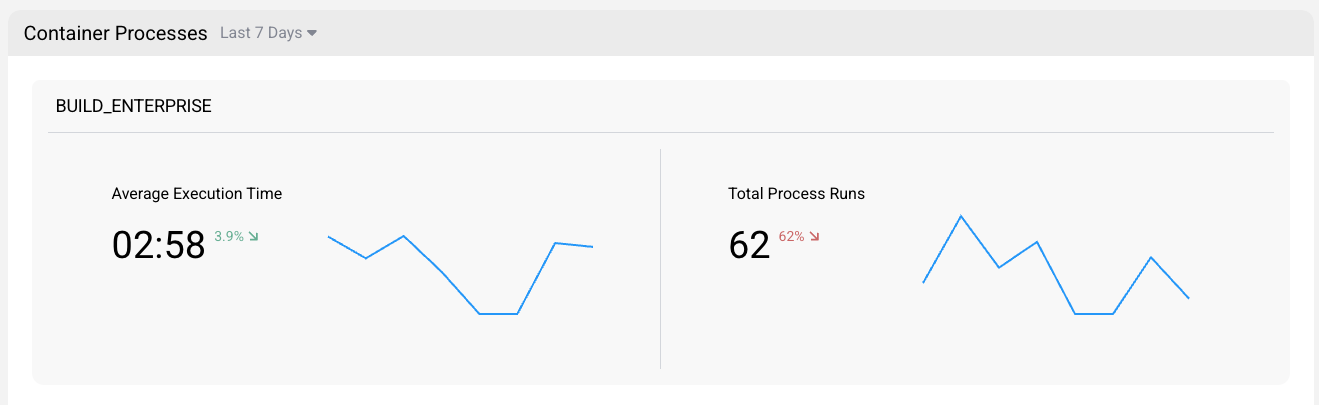
Based on selected period, the graph scale will be adapted accordingly.
Container Process Insights
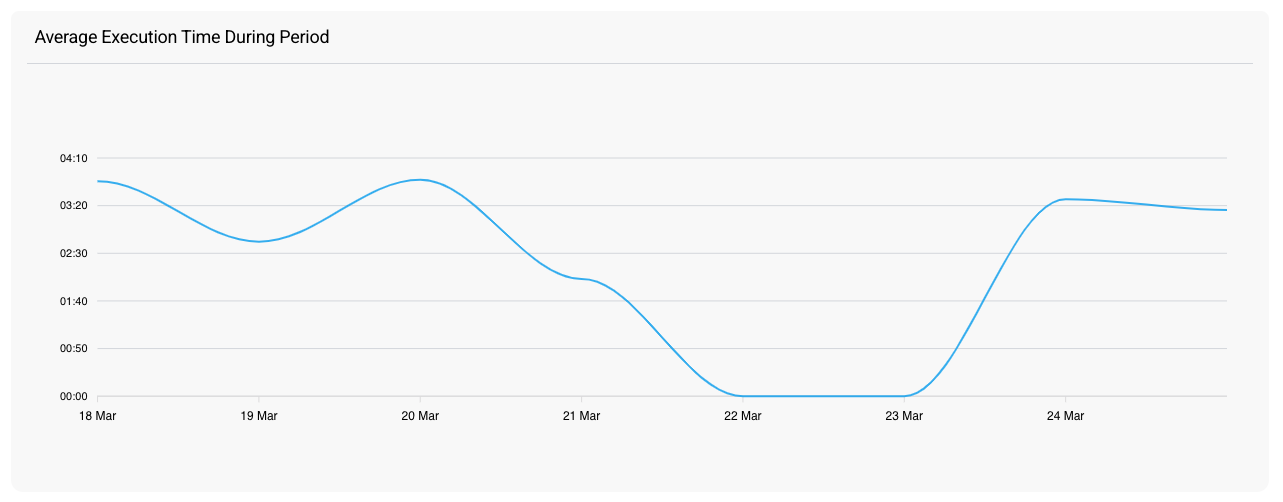
Average
The “average execution time” graph in the container Process section of the Insight dashboard shows the average amount of time it took for a command to be executed within a developer’s workspace, as recorded by the platform’s Command Line Interface (CLI). The period of time displayed on the average execution time graph can be adjusted, allowing you to view metrics for a specific date range.
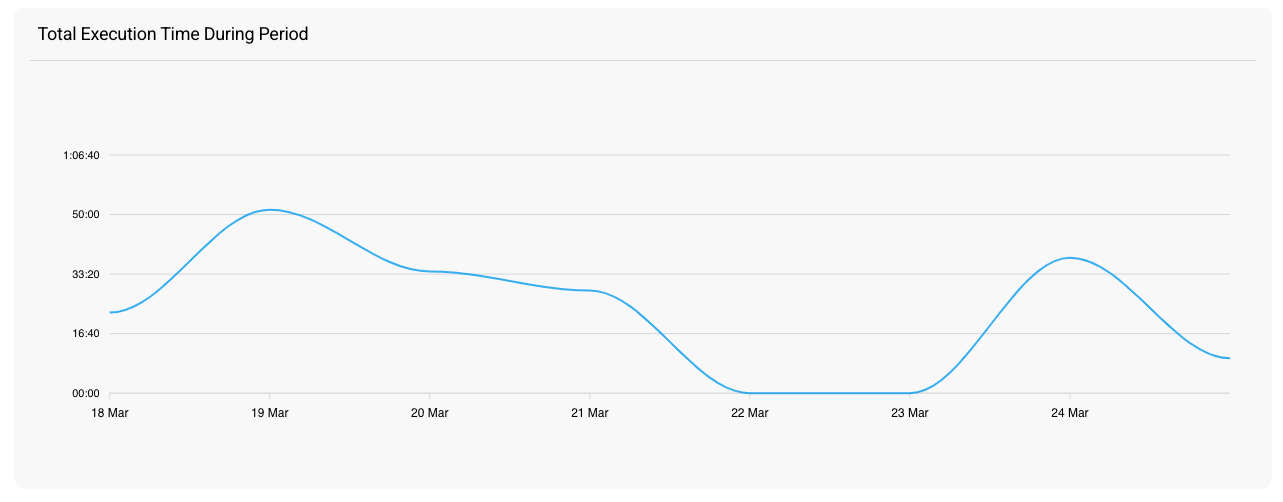
Total
The “total execution time” graph in the container process section of the Insight dashboard shows the total amount of time the command has been executed in a developer’s workspace. The period of time displayed on the total execution time graph can be adjusted, allowing you to view metrics for a specific date range.
Share
Share
In this article
This Preview product documentation is Citrix Confidential.
You agree to hold this documentation confidential pursuant to the terms of your Citrix Beta/Tech Preview Agreement.
The development, release and timing of any features or functionality described in the Preview documentation remains at our sole discretion and are subject to change without notice or consultation.
The documentation is for informational purposes only and is not a commitment, promise or legal obligation to deliver any material, code or functionality and should not be relied upon in making Citrix product purchase decisions.
If you do not agree, select I DO NOT AGREE to exit.