Diagnose Application Performance issues
Application Performance monitoring in Citrix Director (integrated with uberAgent) provides administrators with granular insights into how individual applications—both published and local—are performing. This data helps you identify whether an issue is caused by the application’s resource consumption, network dependencies, or UI unresponsiveness.
Prerequistes
-
VDA Windows version should be greater than or equal to 2603
-
uberAgent must be installed on the VDAs
-
The policy “Enhance Director with uberAgent data for application performance “must be enabled on the studio.
| Policy Name | Policy Description | UI Metrics | Default Value | Value Options | VDA Windows Version | VDA (Linux, Mac) |
|---|---|---|---|---|---|---|
| Enhance Director with uberAgent data for application performance | Enable Director to use machine metrics data provided by uberAgent for application performance | Application name, Is published, Process name, CPU usage %, Memory usage %, Working set memory (MB), Disk IOPS, Disk latency (ms), Network latency (ms), Input delay (ms), CPU usage % (P95), Memory usage % (P95), Input delay (P95) (ms), Page fault per second | Enabled | Enabled or Disabled | 2603 or later | Not Available |
Overview and Key Features
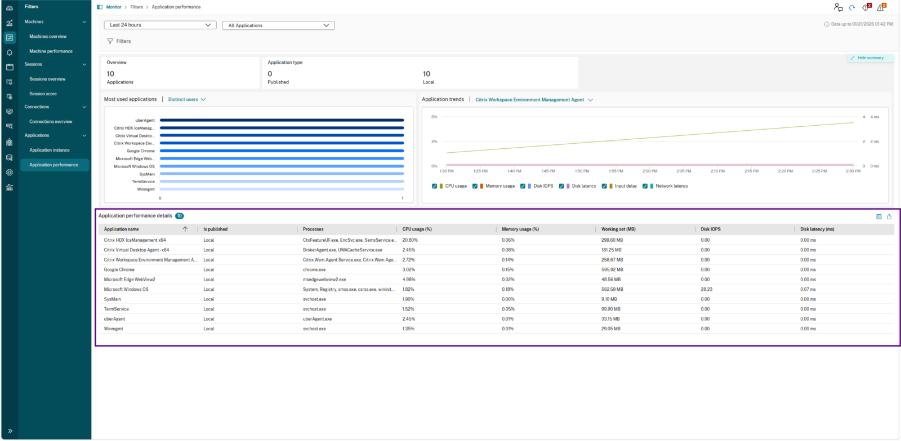
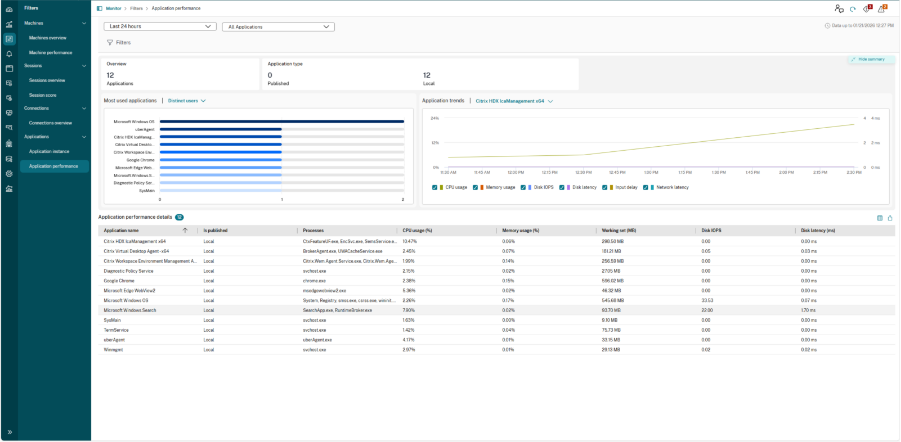
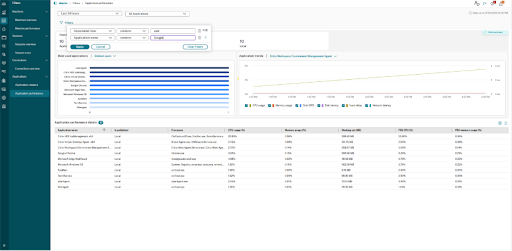
This page details the documentation for the new Application Performance tab, which focuses on real-time and historical monitoring of both published and local applications.
The key features are:
-
Time Range Filters: Enhanced monitoring precision with time range options.
-
Streamlined Filter Management: Intuitive dropdown for managing filters.
-
Intuitive Filter Building: Flexible workflow for creating and modifying filters directly on the main page.
-
Visualizations: Introduction of the Application Distribution chart and Performance Over Time chart for immediate insight into application performance trends.
Filtering Data
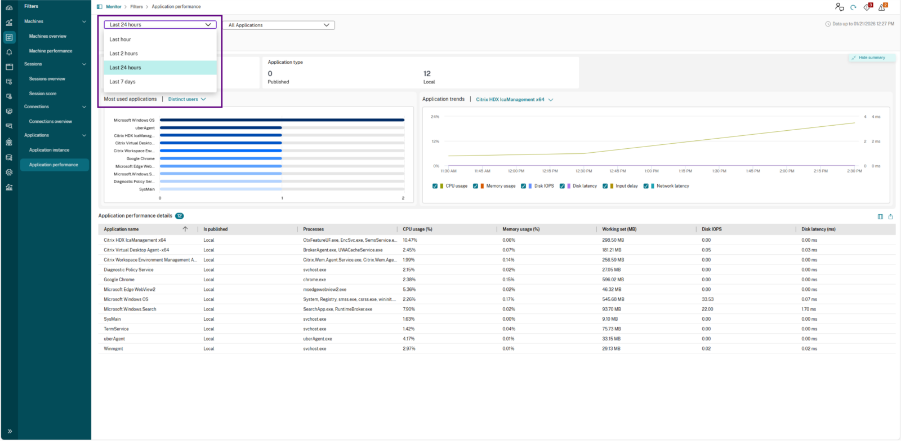
At the top of the page, you can define the scope of the data displayed.
- Time Period: Choose the time range. The time range filter includes 1 hour, 2 hours, 1 day or seven days
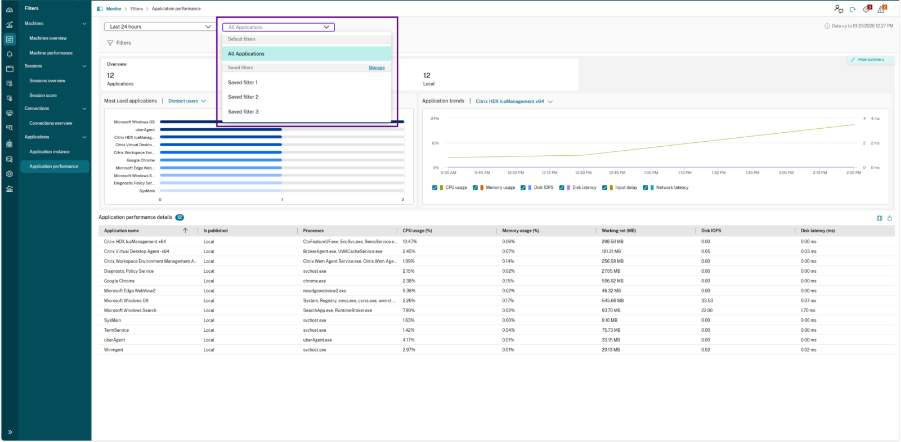
- Application Scope: Use the application dropdown to filter the entire dashboard by a specific filter or view All Applications.
-
Filters: Use the Filters icon to further refine data.
-
Manage: Clicking Manage opens a side panel where you can search for, view, or delete existing saved filters.
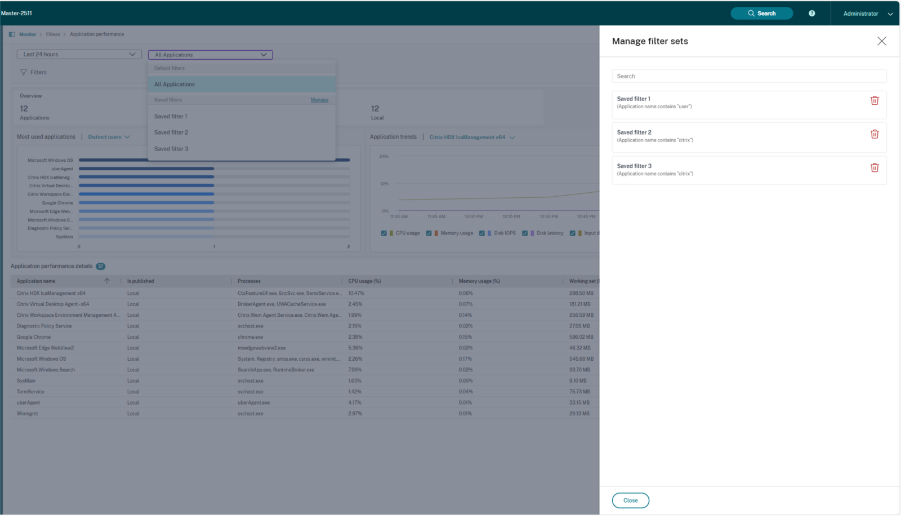
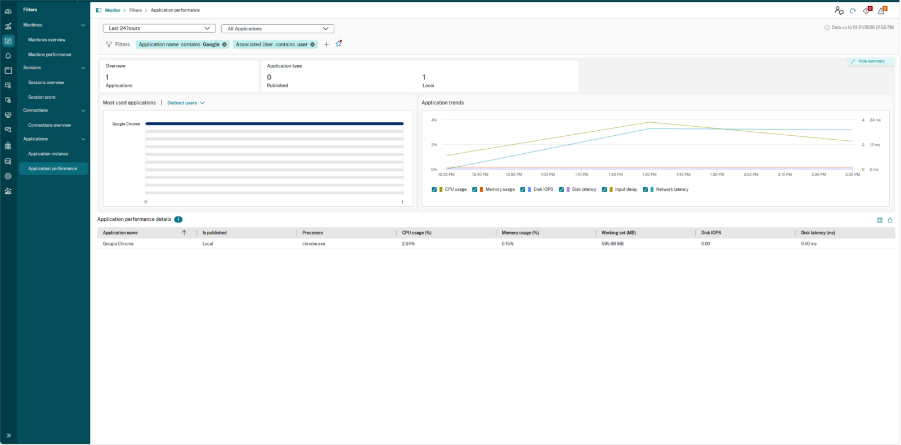
Building and Applying Filters
You can now build complex filter sets directly on the applications overview page:
- Click the Filters icon or the + button next to an existing filter.
- Select the criteria (e.g., Application name), the operator (e.g., contains), and the value (e.g., Google).
Filter Save Status and Workflow
The star icon (⋆) next to the active filters visually indicates the status of your current filter set. This helps to guide admins for saving, applying, and managing custom filters.
| Filter Status | Icon Appearance | Meaning | Required Action |
|---|---|---|---|
|
Unsaved Filter
|
 |
The current combination of filter criteria has not been saved.
|
Click the empty star to open the dialog box, name the filter set, and save it.
|
| (Empty outline with a Red Dot) | |||
| Saved Filter
|
 |
The currently active filter set is an exact match to a previously saved filter.
|
No action required. You are viewing data based on a defined template.
|
| (Filled / Solid) | |||
| Saved Filter with Changes
|
 |
When using a saved filter, any other filter is added, removed, or if any column is sorted then the red dot appears which means the changes are not yet saved.
|
Click the red-dotted star to update the existing saved filter, or use the dropdown to select Save as filter set to create a new one.
|
| (Filled with Red Dot) |
Filter Action Buttons
When adding new filters or modifying a saved filter, the following controls and status indicators become available:
| Button | Meaning and Action |
|---|---|
| Update | Applies all currently active filter criteria to the charts and the application performance data table. |
| Cancel | Discards any changes made to the current filter set and reverts to the last applied filter. |
| Clear filters | Removes all the newly added filter criteria. |
 Icon Icon
|
Removes the selected filter criteria on which this icon is clicked. |
Visualization
Overview Summary
The summary pane provides an immediate count of the applications currently being monitored:
-
Applications: The total number of unique application names detected in the environment.
-
Application Type: A breakdown of how many is Published applications versus Local applications running on the VDA.
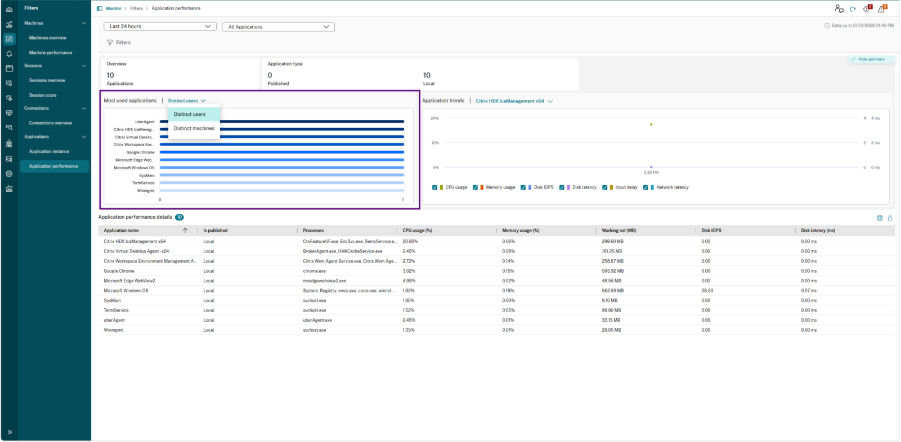
Distribution Chart
The Distribution chart serves as a histogram that categorizes the number of application instances based on specific performance buckets. It is designed to help you understand the “spread” of the user experience across your environment.
-
Metric Grouping: The X-axis represents ranges of the selected metric (such as UI Delay or Startup Duration), while the Y-axis represents the count of occurrences within those ranges.
-
View Perspectives: A drop-down menu allows you to toggle the data representation between two views:
-
Distinct Users: Shows the distribution of performance based on the number of unique users
-
Distinct Machines: Shows the distribution based on the number of VDAs.
-
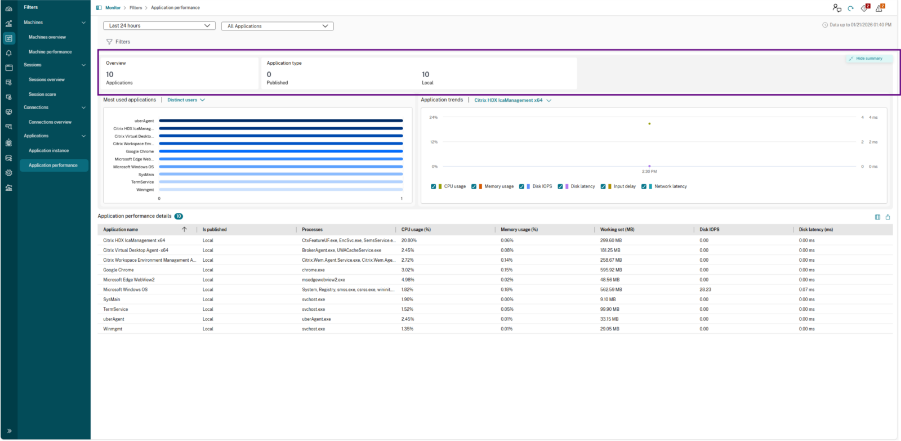
Performance Chart
The Performance chart is a time-series visualization that tracks application health over a selected duration. It allows you to correlate performance changes with specific time intervals and resource consumption.
-
Application Selection: Use the drop-down menu at the top of the chart to select a specific application to analyse.
-
Multi-Metric Correlation: The chart allows you to overlay several key performance indicators (KPIs) simultaneously to find correlations between responsiveness and resource usage:
-
CPU and Memory Usage: Displays the percentage of resource consumption by the application.
-
Disk IOPS and Disk Latency: Identifies if storage bottlenecks are impacting application performance.
-
Input Delay: Measures the time between a user action and the application’s response.
-
Network Latency: Tracks the network delay associated with the application’s communication.
-
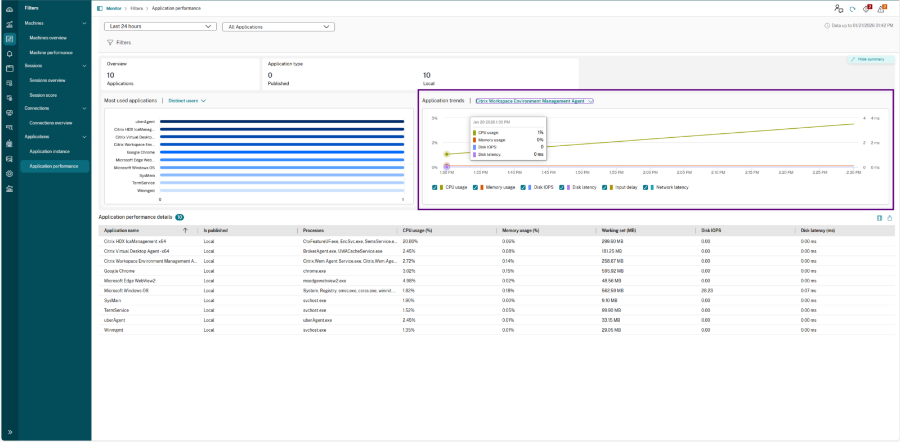
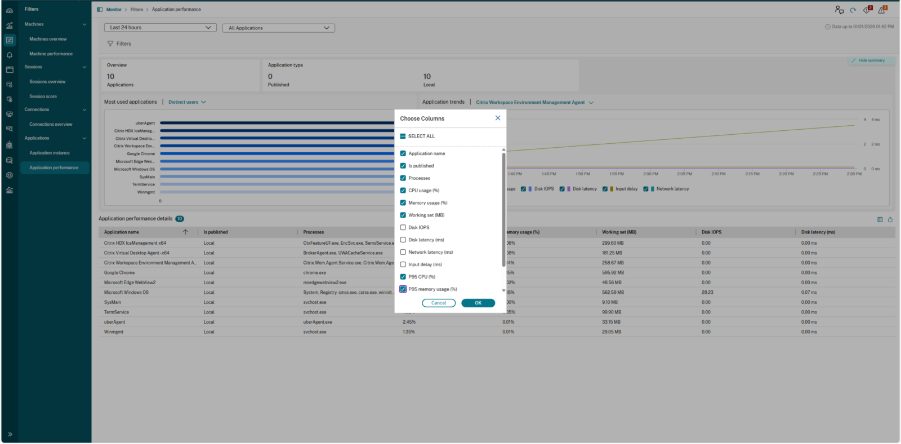
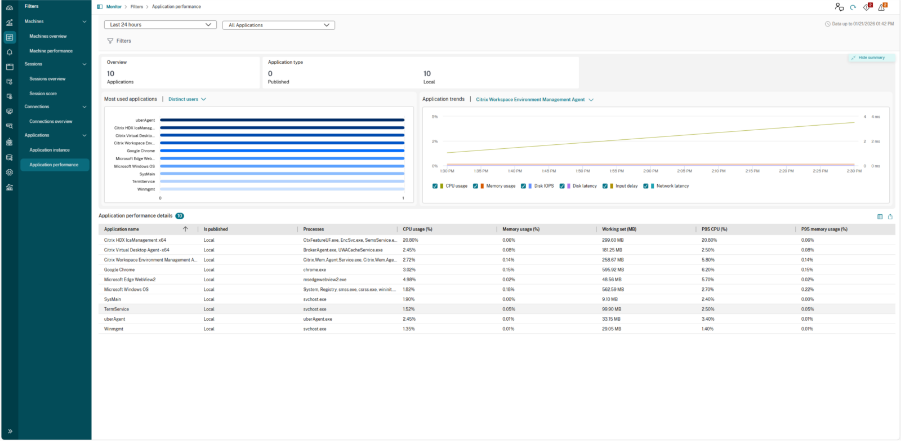
Application Performance Details (Table)
The bottom pane provides the raw, actionable data for every application instance. The data can be exported, and the desired columns can be chosen to be displayed.