Monitor and support
You can use the Citrix Endpoint Management Dashboard and the Citrix Endpoint Management Support page to monitor and troubleshoot your Citrix Endpoint Management server. Use the Citrix Endpoint Management Support page to access support-related information and tools.
In the Citrix Endpoint Management console, click the wrench icon in the upper-right corner.

The Troubleshooting and Support page appears.
Use the Citrix Endpoint Management Troubleshooting and Support page to:
- Access diagnostics.
- Access links to Citrix Product Documentation and the Knowledge Center.
- Access log operations.
- Use advanced configuration options.
- Access a set of tools and utilities.
You can also view information at a glance by accessing your Citrix Endpoint Management console dashboard. With this information, you can see issues and successes quickly by using widgets.
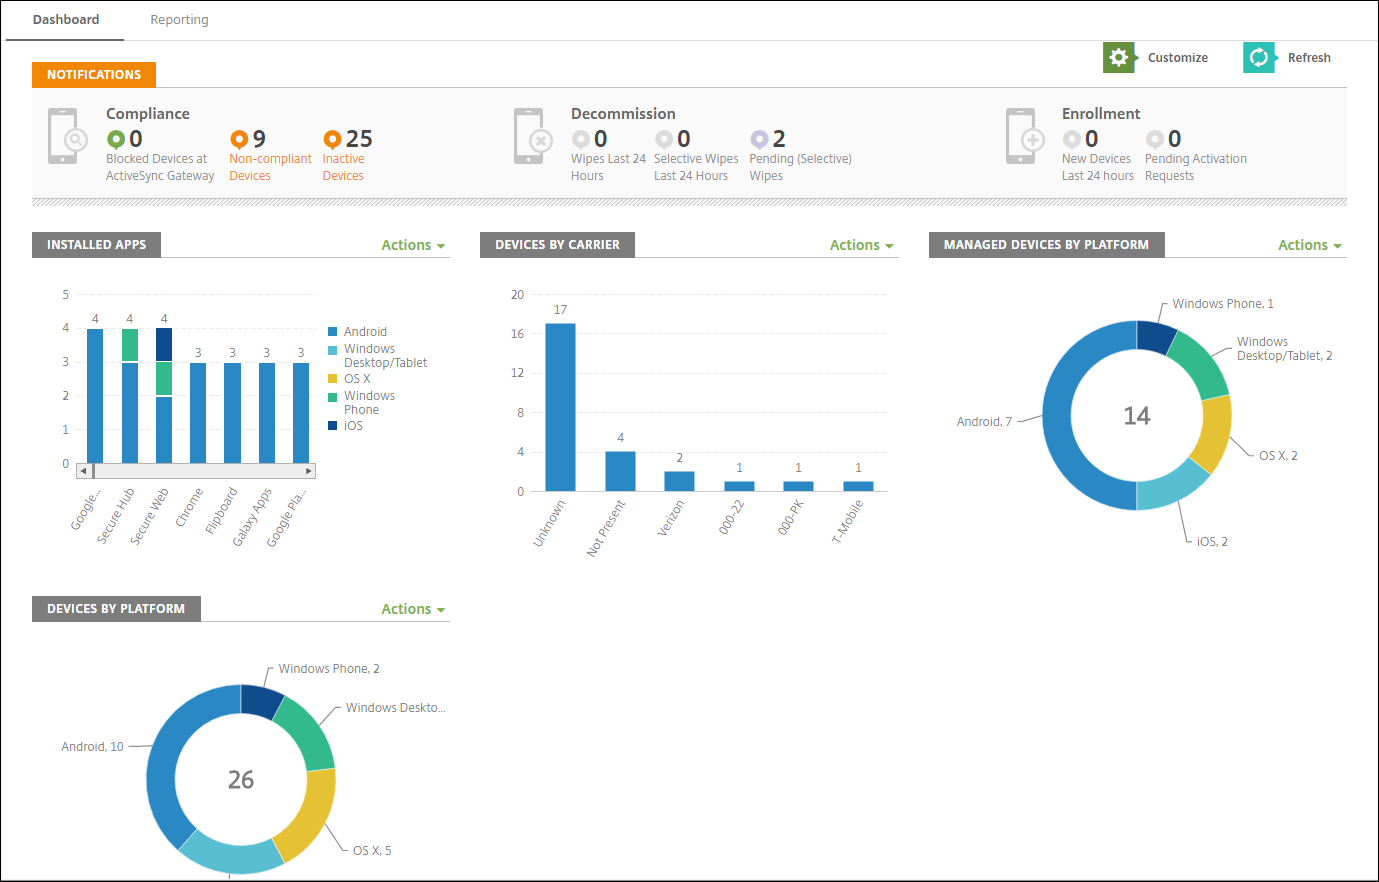
The dashboard is usually the page that first appears when you sign on to the Citrix Endpoint Management console. To access the dashboard from elsewhere in the console, click Analyze. Click Customize on the dashboard to edit the layout of the page and to edit the widgets that appear.
- My Dashboards: You can save up to four dashboards. You can edit these dashboards separately and view each one by selecting the saved dashboard.
- Layout Style: In this row, you can select how many widgets appear on your dashboard and how the widgets are laid out.
-
Widget Selection: You can choose which information appears on your dashboard.
- Notifications: Mark the checkbox above the numbers on the left to add a Notifications bar above your widgets. This bar shows the number of compliant devices, inactive devices, and devices wiped or enrolled in the last 24 hours.
- Devices By Platform: Displays the number of managed and unmanaged devices by platform.
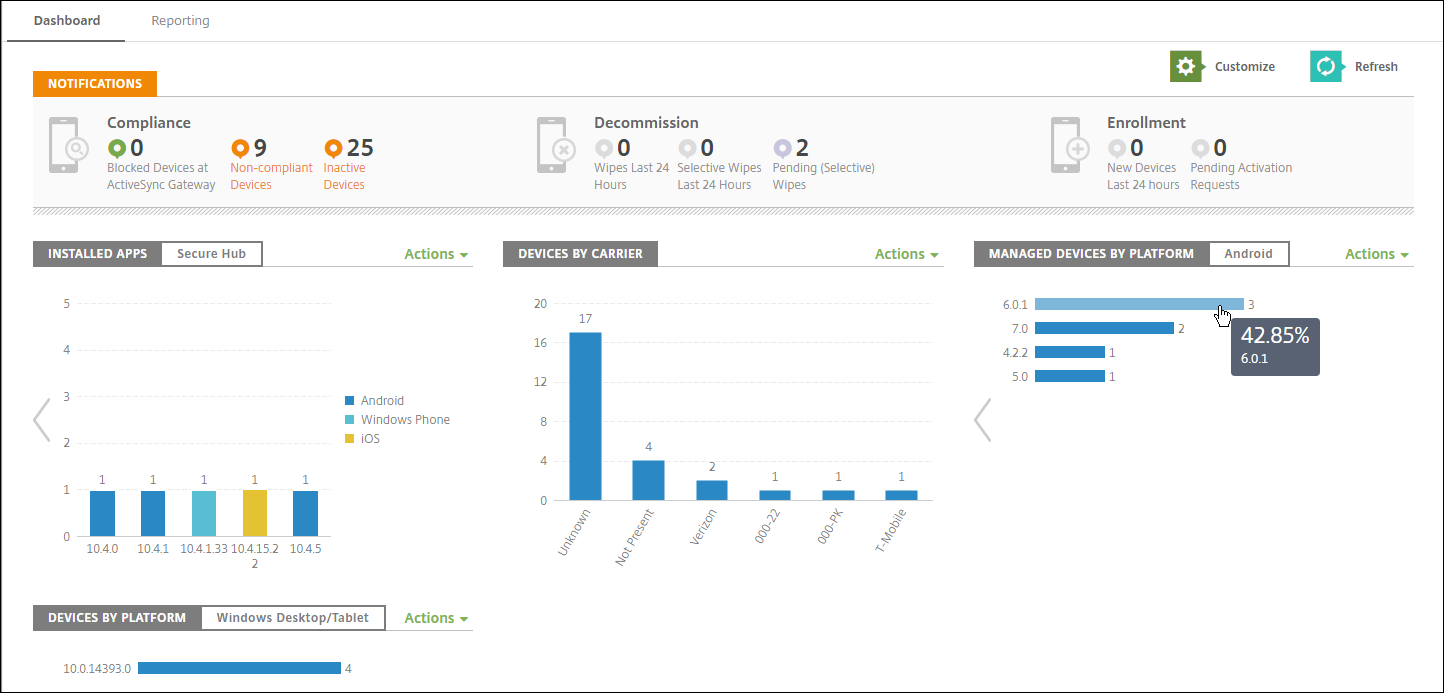
- Devices By Carrier: Displays the number of managed and unmanaged devices by carrier. Click each bar to see a breakdown by platform.
- Managed Devices By Platform: Displays the number of managed devices by platform.
- Unmanaged Devices By Platform: Displays the number of unmanaged devices by platform. Devices that appear in this chart might have an agent installed, but their privileges are revoked or the devices are wiped.
- Devices By ActiveSync Gateway Status: Displays the number of devices grouped by ActiveSync Gateway status. The information shows Blocked, Allowed, or Unknown status. You can click each bar to break down the data by platform.
- Devices By Ownership: Displays the number of devices grouped by ownership status. The information shows corporate-owned, employee-owned, or unknown ownership status.
- Failed Delivery Group Deployments: Displays the total number of failed deployments per package. Only packages that have failed deployments appear.
- Devices By Blocked Reason: Displays the number of devices blocked by ActiveSync
- Installed Apps: Type an app name for a graph of app information.
- Volume Purchase Apps License Usage: Displays license usage statistics for the Apple Volume Purchase apps.
With each widget, you can click the individual parts to drill down for more information.
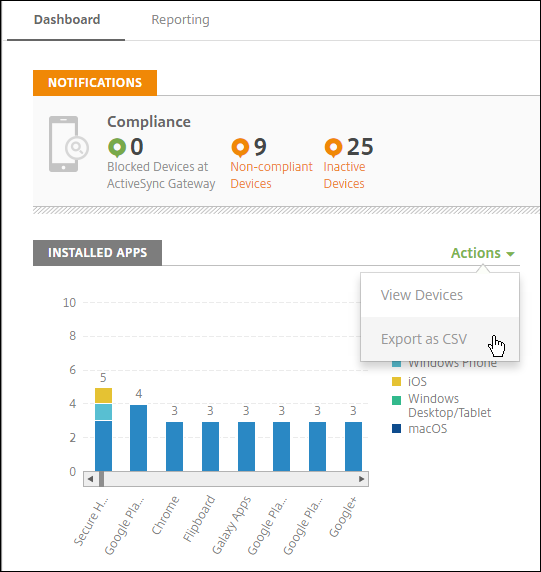
You can also export the information as a .csv file by clicking the Action menu.
Monitor page for help desk administrators
You can monitor and troubleshoot Citrix Endpoint Management on the Monitor page. This interface is customized for help desk administrators to carry out user-based troubleshooting efficiently.
Help Desk administrators must have the following permissions to access the Monitor page and all available workflows:
- Authorized access
- Admin console access
- Public api access
- Console Features
- Monitor
- Devices
- Full Wipe Device
- View Locations
- Locate Device
- Track Device
- Lock device
- Unlock device
- App Lock
- App Wipe
- App
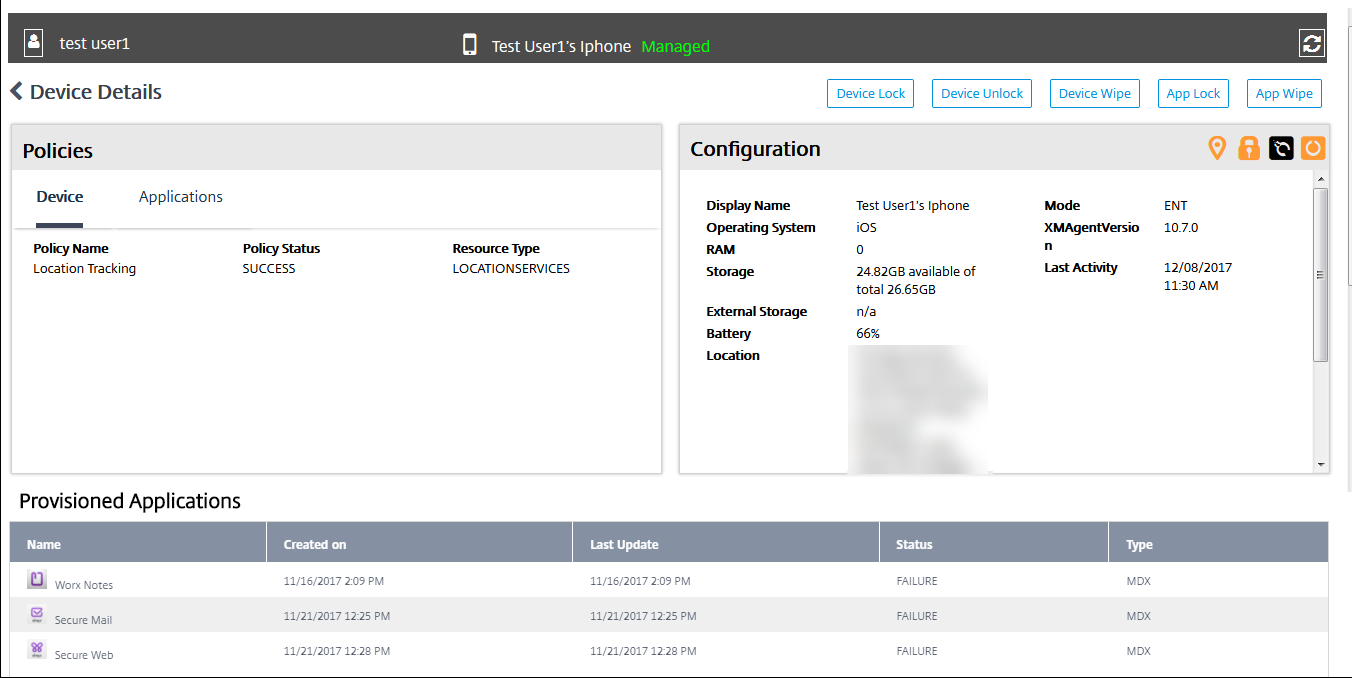
The Monitor page gives you a combined view of device policies and configuration. The view includes troubleshooting actions such as app lock/unlock, app wipe, device lock/unlock, and device wipe.
Use the Monitor page to:
- Search for an Active Directory (AD) user and device you want to troubleshoot.
- Analyze the Device Details page that has the following:
- Policies: Displays device and app policies for the selected device and app. For information about modifying policies, see Device policies and Add apps.
- Configuration: Displays the device configuration. This panel includes icons that indicate whether the device has location services enabled, is jailbroken, and is MDM or MAM managed. The panel also shows the storage encryption status.
- Running Applications table: Displays the details of the applications currently running on the device.
- Troubleshoot the device. Security actions available on this page are based on the enrollment of the device, and the permissions available to the logged in administrator:
- Device lock/unlock
- Device wipe
- App lock/unlock (available if the device is MAM enrolled)
- App wipe (available if the device is MAM enrolled)
For more information about the actions you can take, see Security actions.
The Monitor page might not operate as expected 60 minutes after it was last loaded, because it does not handle refreshes of the login token. As a workaround, refresh the token by reloading the page: Click the Citrix Cloud link on your service console and then click Citrix Endpoint Management > Manage > Monitor.
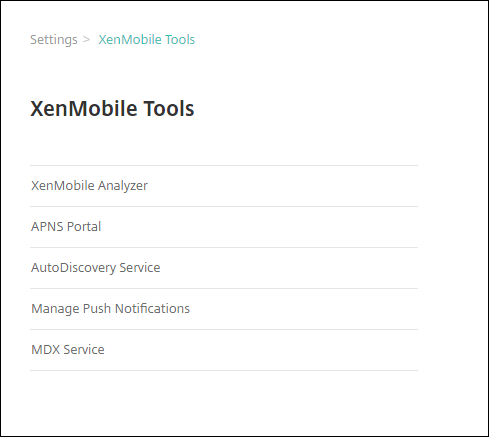
Access to Citrix Endpoint Management Tools from the console
You can access these Citrix Endpoint Management Tools from the Citrix Endpoint Management console:
- APNs Portal – Submit a request to Citrix to sign an APNs certificate, which you then submit to Apple.
- Auto Discovery Service – Request and configure AutoDiscovery for Citrix Endpoint Management in your domain.
- Manage Push Notifications – Manage push notifications for iOS and Windows mobile apps.
To access these tools, go to Settings > Citrix Endpoint Management Tools. This page is available to users with the Cloud Admin or Customer Admin role.
View and analyze log files in Citrix Endpoint Management
-
In the Citrix Endpoint Management console, click the wrench icon in the upper-right corner of the console. The Troubleshooting and Support page opens.
-
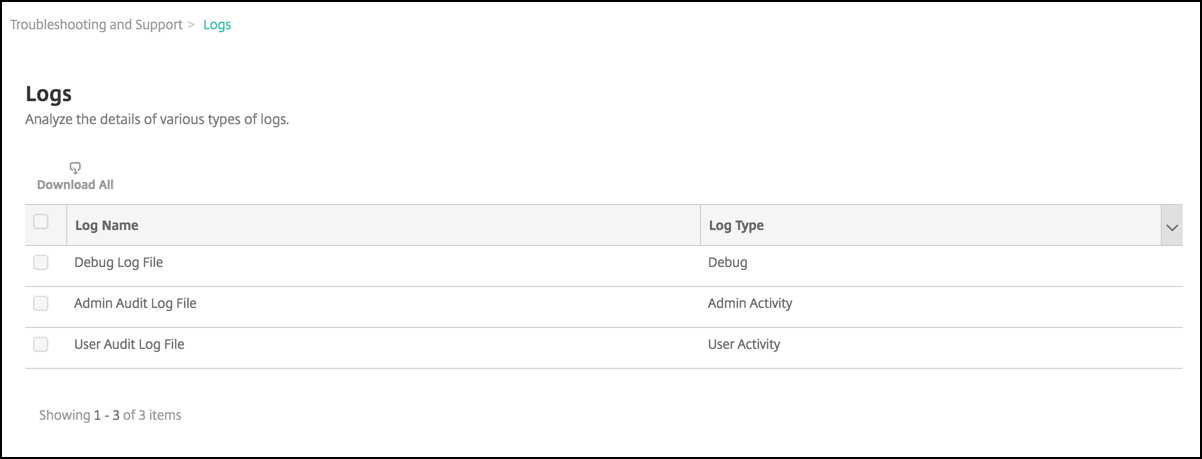
Under Log Operations, click Logs. The Logs page appears. Individual logs appear in a table.
-
Select the log that you want to view:
- Debug Log Files have information useful for Citrix Support, such as error messages and server-related actions.
- Admin Audit Log Files have audit information about activity on the Citrix Endpoint Management console.
- User Audit Log Files have information related to configured users.
-
Use the actions at the top of the table to download all, view, or download a single log.
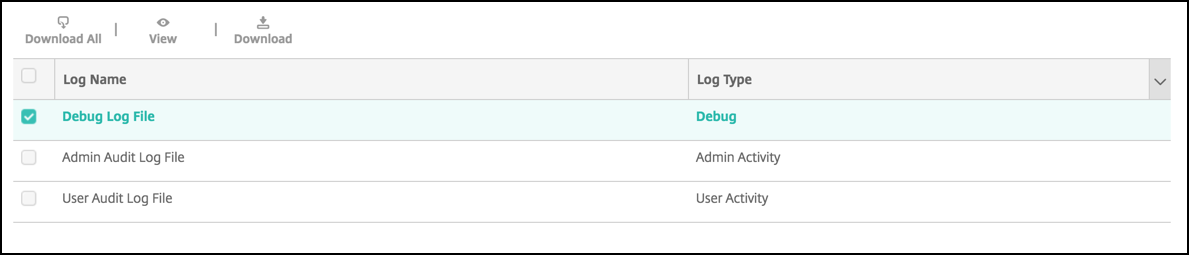
Note:
If you select multiple log files, only Download All is available.
-
Do one of the following:
- Download All: The console downloads all the logs present on the system (including debug, admin audit, user audit, server logs, and so on).
- View: Shows the contents of the selected log below the table.
- Download: The console downloads only the single log file type selected. The console also downloads any archived logs for that same type.
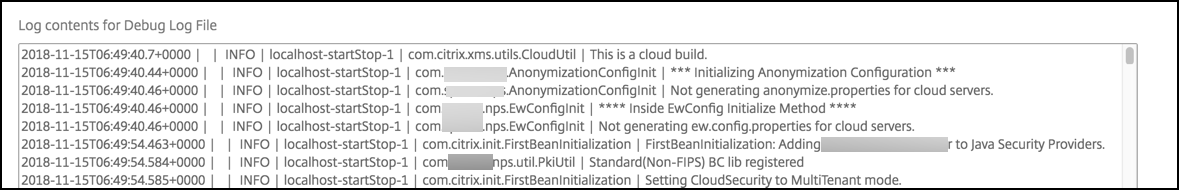
Citrix Endpoint Management uses the log4j syslog appender to send RFC5424 formatted syslog messages. The syslog message data is plain text with no specific format.