Diagnostic logs
FAQ
What are Secure Private Access diagnostic logs?
Secure Private Access diagnostic logs capture all events that occur when a user accesses any application (Web/SaaS/TCP/UDP). These logs capture device posture, app authentication, app enumeration, and app access logs. The details are presented in a tabular format. You can view the logs for the pre-set time or for a custom timeline. You can add columns to the chart by clicking the + sign depending on what information you want to see in the dashboard. You can export the user logs into CSV format.
Where do I find Secure Private Access logs?
- Log on to Citrix Cloud.
- On the Secure Private Access service tile, click Manage.
- Click Dashboard on the left navigation in the admin user interface.
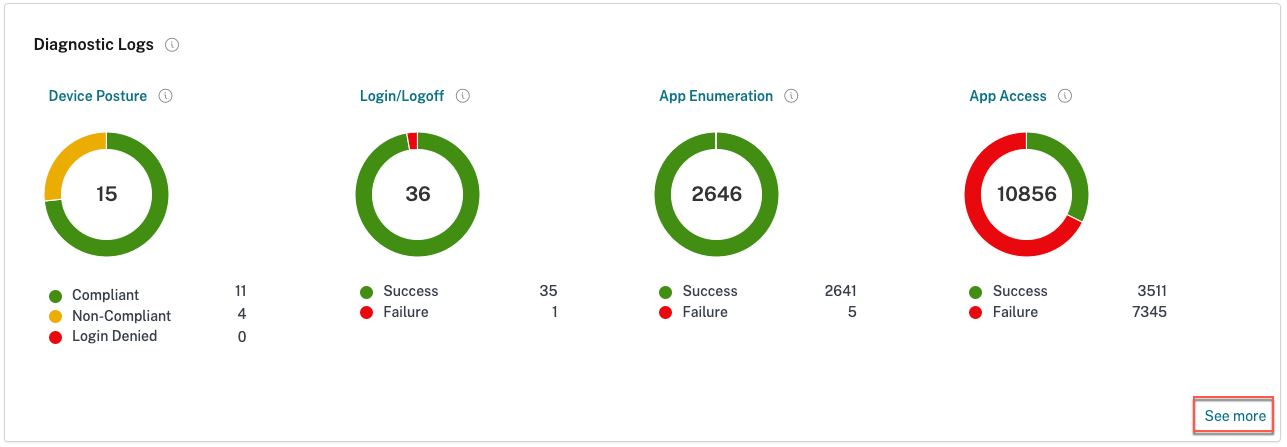
- In the Diagnostic Logs chart, click the See more link.
Which widget displays the Secure Private Access diagnostic logs?
The Diagnostics Logs widget in the Logging and Troubleshooting section displays a pie chart view of all Secure Private Access events related to authentication, application launch, app enumeration, and also logs related to device posture. The Secure Private Access diagnostic logs fetch events from multiple internal components, each sending an event when an end user accesses an application. These events are divided in categories; Login/Logoff, App Enumeration, and App Access. The pie chart displays the overall success/failures ratio of each category. Clicking the colored pie on any chart takes you to the diagnostic logs where you can find the appropriate events. There are also device posture logs if you have Device Posture service enabled. You can also click the See more link to view the complete diagnostic logs.
What details can I find in the Secure Private Access diagnostic logs?
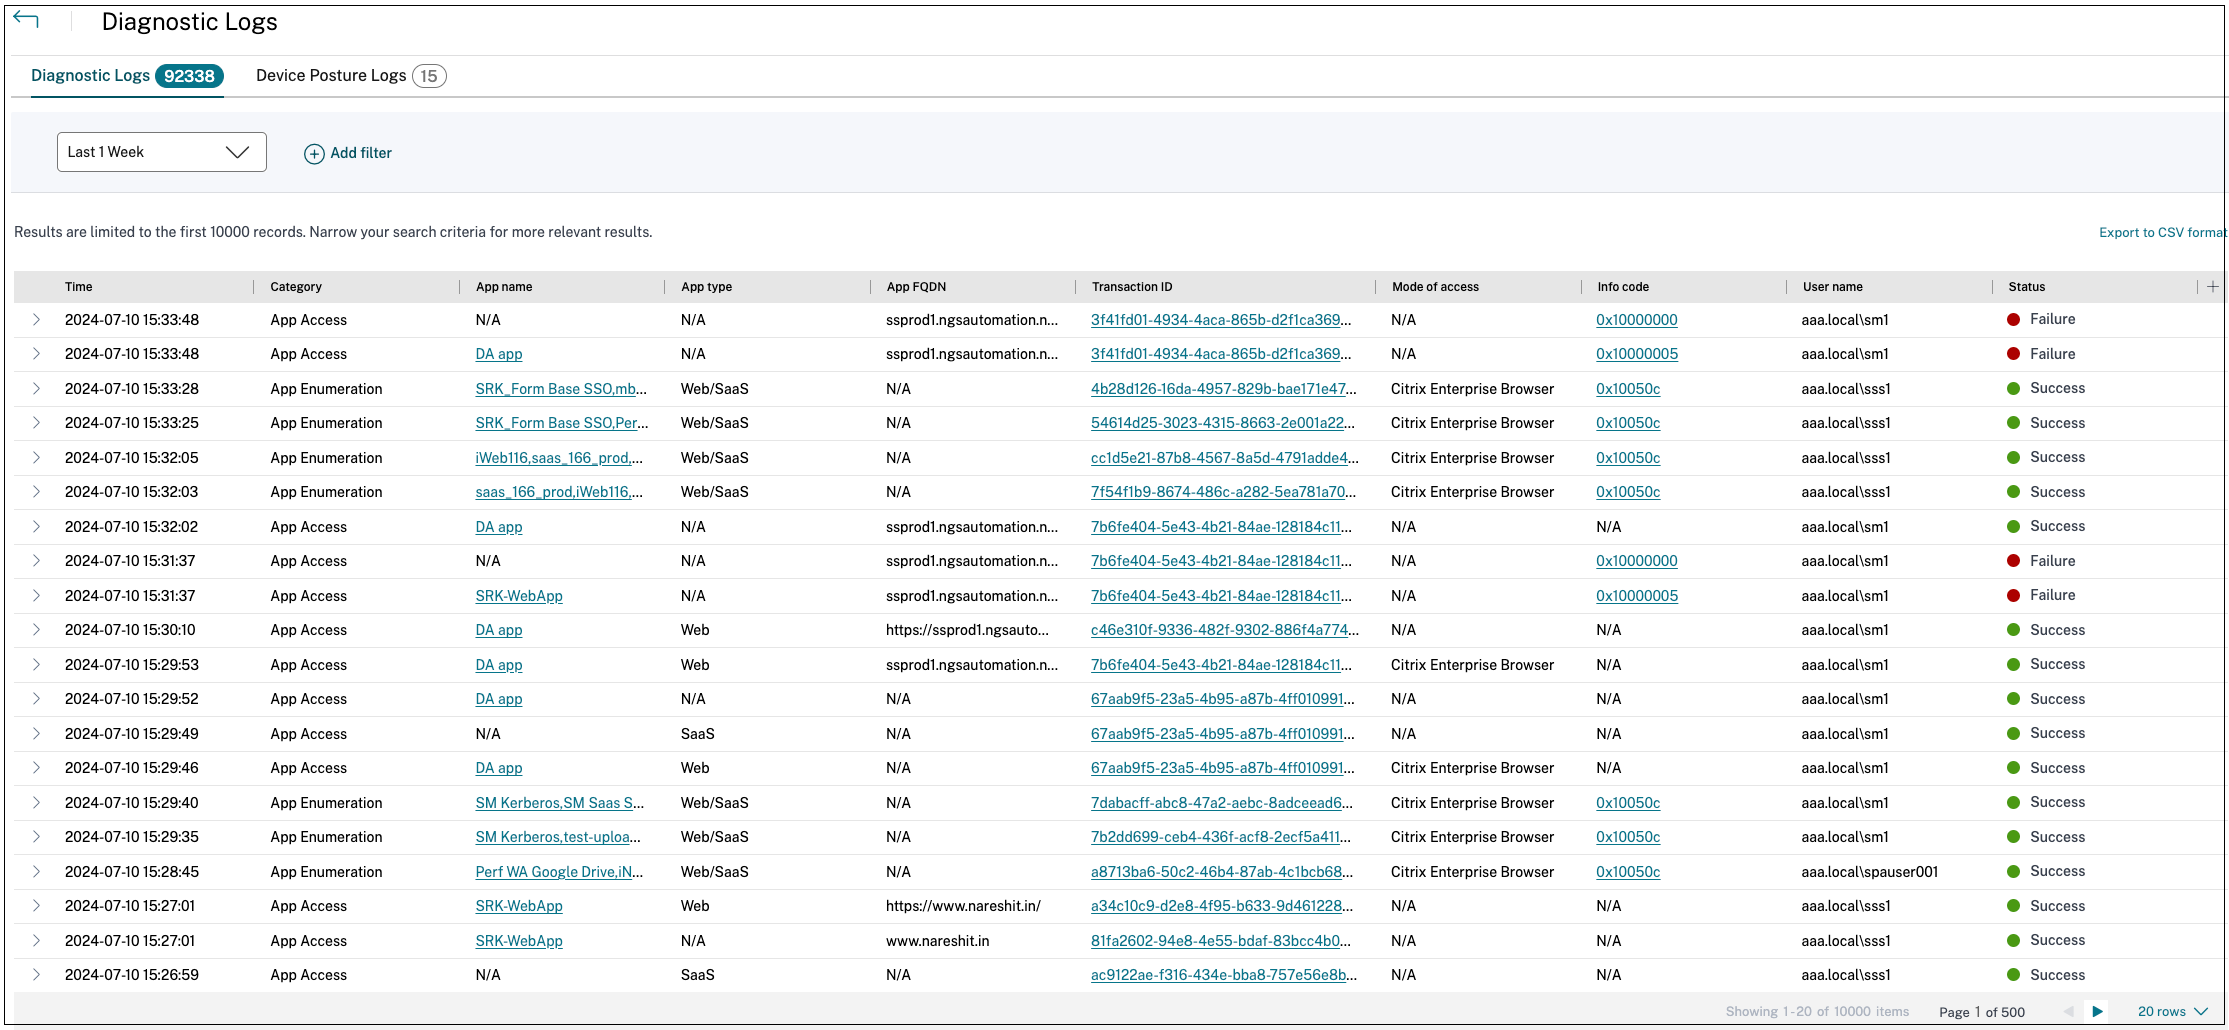
The Secure Private Access user logs dashboard provides the following details, by default.
- Timestamp - Time of the event in UTC.
- Username - User name of the end-user accessing the app.
- App Name - Name of the app/apps that were accessed.
- Policy Info - Name of the access policy or policies that were triggered during the event.
- Status - Status of the event, success, or failure.
- Info Code - Code associated with each failure event within the Secure Private Access diagnostic logs dashboard. See more information on info code.
- Description - Reason for the failure or more details about the event.
- APP FQDN: FQDN of the application accessed.
- Event type - Event type associated with the operation performed.
- Operation type - Operation for which the log is generated.
- Category - Category available, depending on the type of event. Available options are: app authentication, app enumeration, or app access. These options are also available as filter options. You can use these options to filter logs depending on the type of issue that you are facing.
- Transaction ID - Transaction ID correlates all Secure Private Access logs for an access request. Learn how to use a transaction ID. The following details can be fetched by clicking the + button on the rightmost side of the dashboard:
- SPA PoP Location - Name/ID of the Secure Private Access service PoP location that was used during app access. See Secure Private Access PoP Locations.
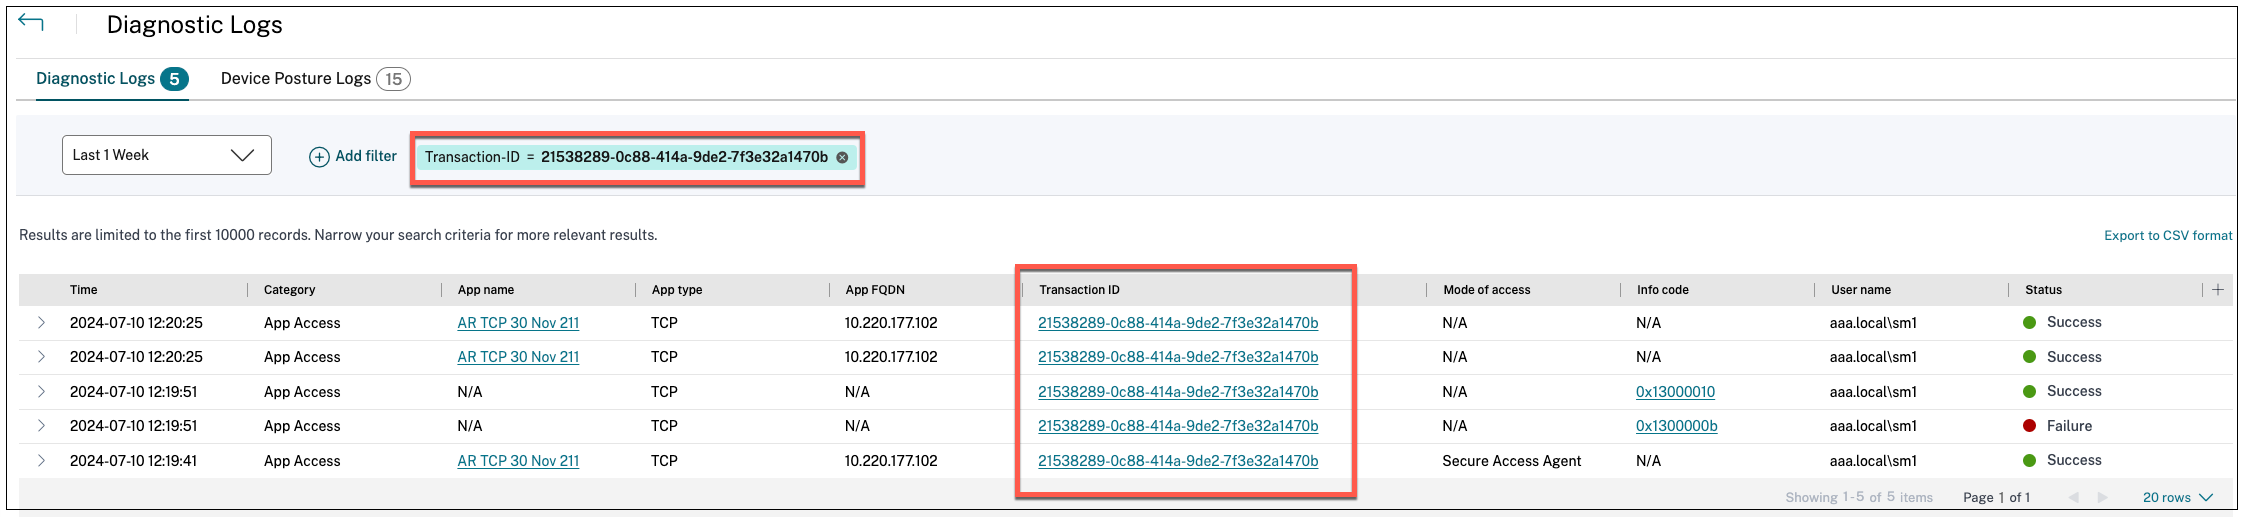
How do I filter the diagnostic logs?
You can use the Add Filter option to refine you search based on the various criteria, such as app type, category, description. For example, in the Search field, you can click Transaction ID, = (equals to some value), and enter 21538289-0c88-414a-9de2-7f3e32a1470b, to search for all logs related to this transaction ID. For details on search operators that can be used with the filter option, see Search operators.
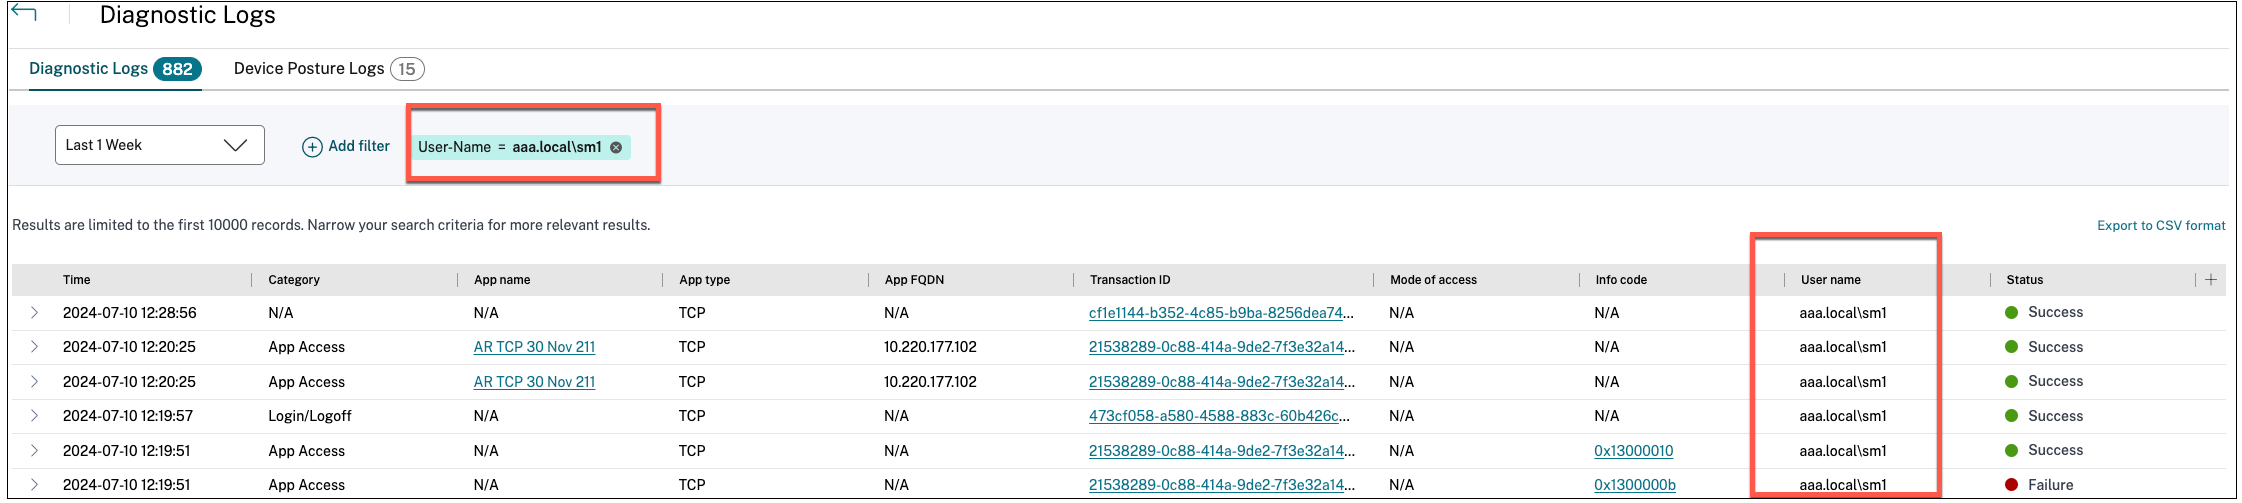
You can also use the various filter options to refine your search on the Device Posture logs.
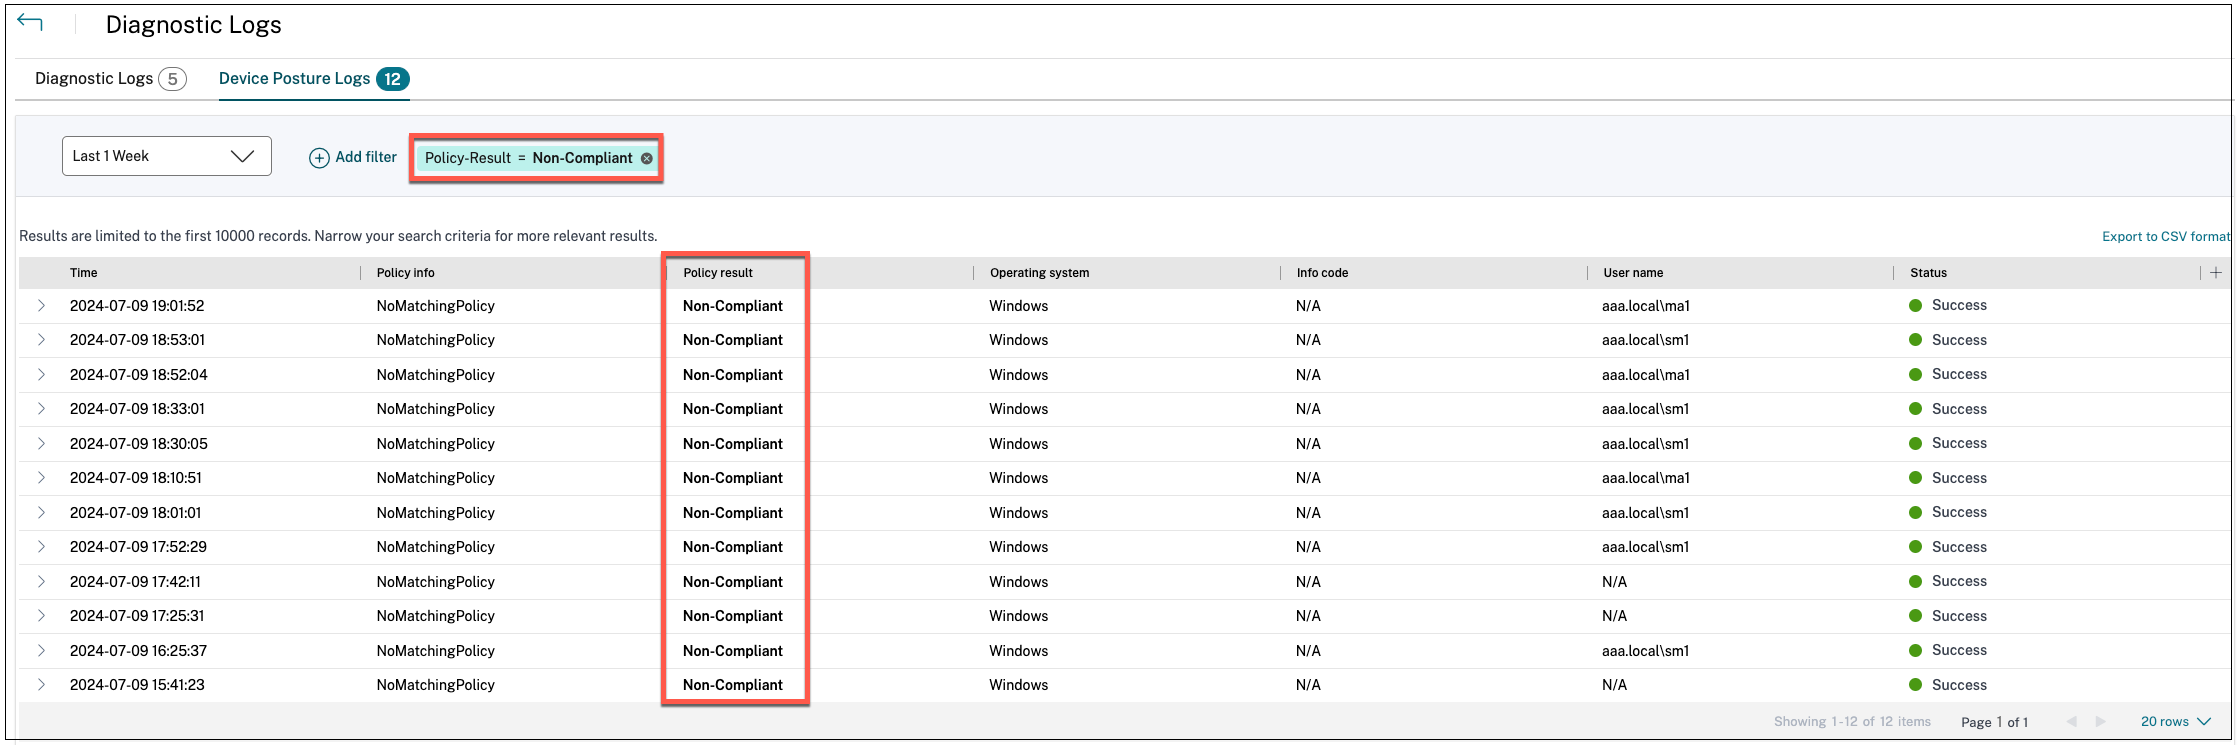
What events are captured in the Secure Private Access diagnostic logs?
The Secure Private Access diagnostic logs capture the following events:
- Device Posture: End-user device status. These logs capture information about the device posture results, whether the device was deemed compliant, non-compliant, or denied access based on your device posture policy.
- Login/Logoff: Events related end-user logon or logoff status to the Citrix Secure Access client and authentication to workspace (internal or external providers).
- App Enumeration: In the Secure Private Access service, access policies configured by admins decide which user gets to access which app. Denied applications are not visible (not enumerated) to end-users within Citrix Workspace App. These events help you know which applications were allowed or denied Access to a user based on the access policies configured within the Secure Private Access service.
- App Access: Events of end-user application/endpoint access, allow/deny status, single sign-on status, and connectivity status as per the configured access policies for the selected time interval.
List of errors
For a comprehensive list of errors that users might encounter when using the Secure Private Access service, see Diagnostic log info codes.
In this article
-
FAQ
- What are Secure Private Access diagnostic logs?
- Where do I find Secure Private Access logs?
- Which widget displays the Secure Private Access diagnostic logs?
- What details can I find in the Secure Private Access diagnostic logs?
- How do I filter the diagnostic logs?
- What events are captured in the Secure Private Access diagnostic logs?
- List of errors