VDA Health Monitoring Metrics via UberAgent Lite
1. Introduction: What’s New?
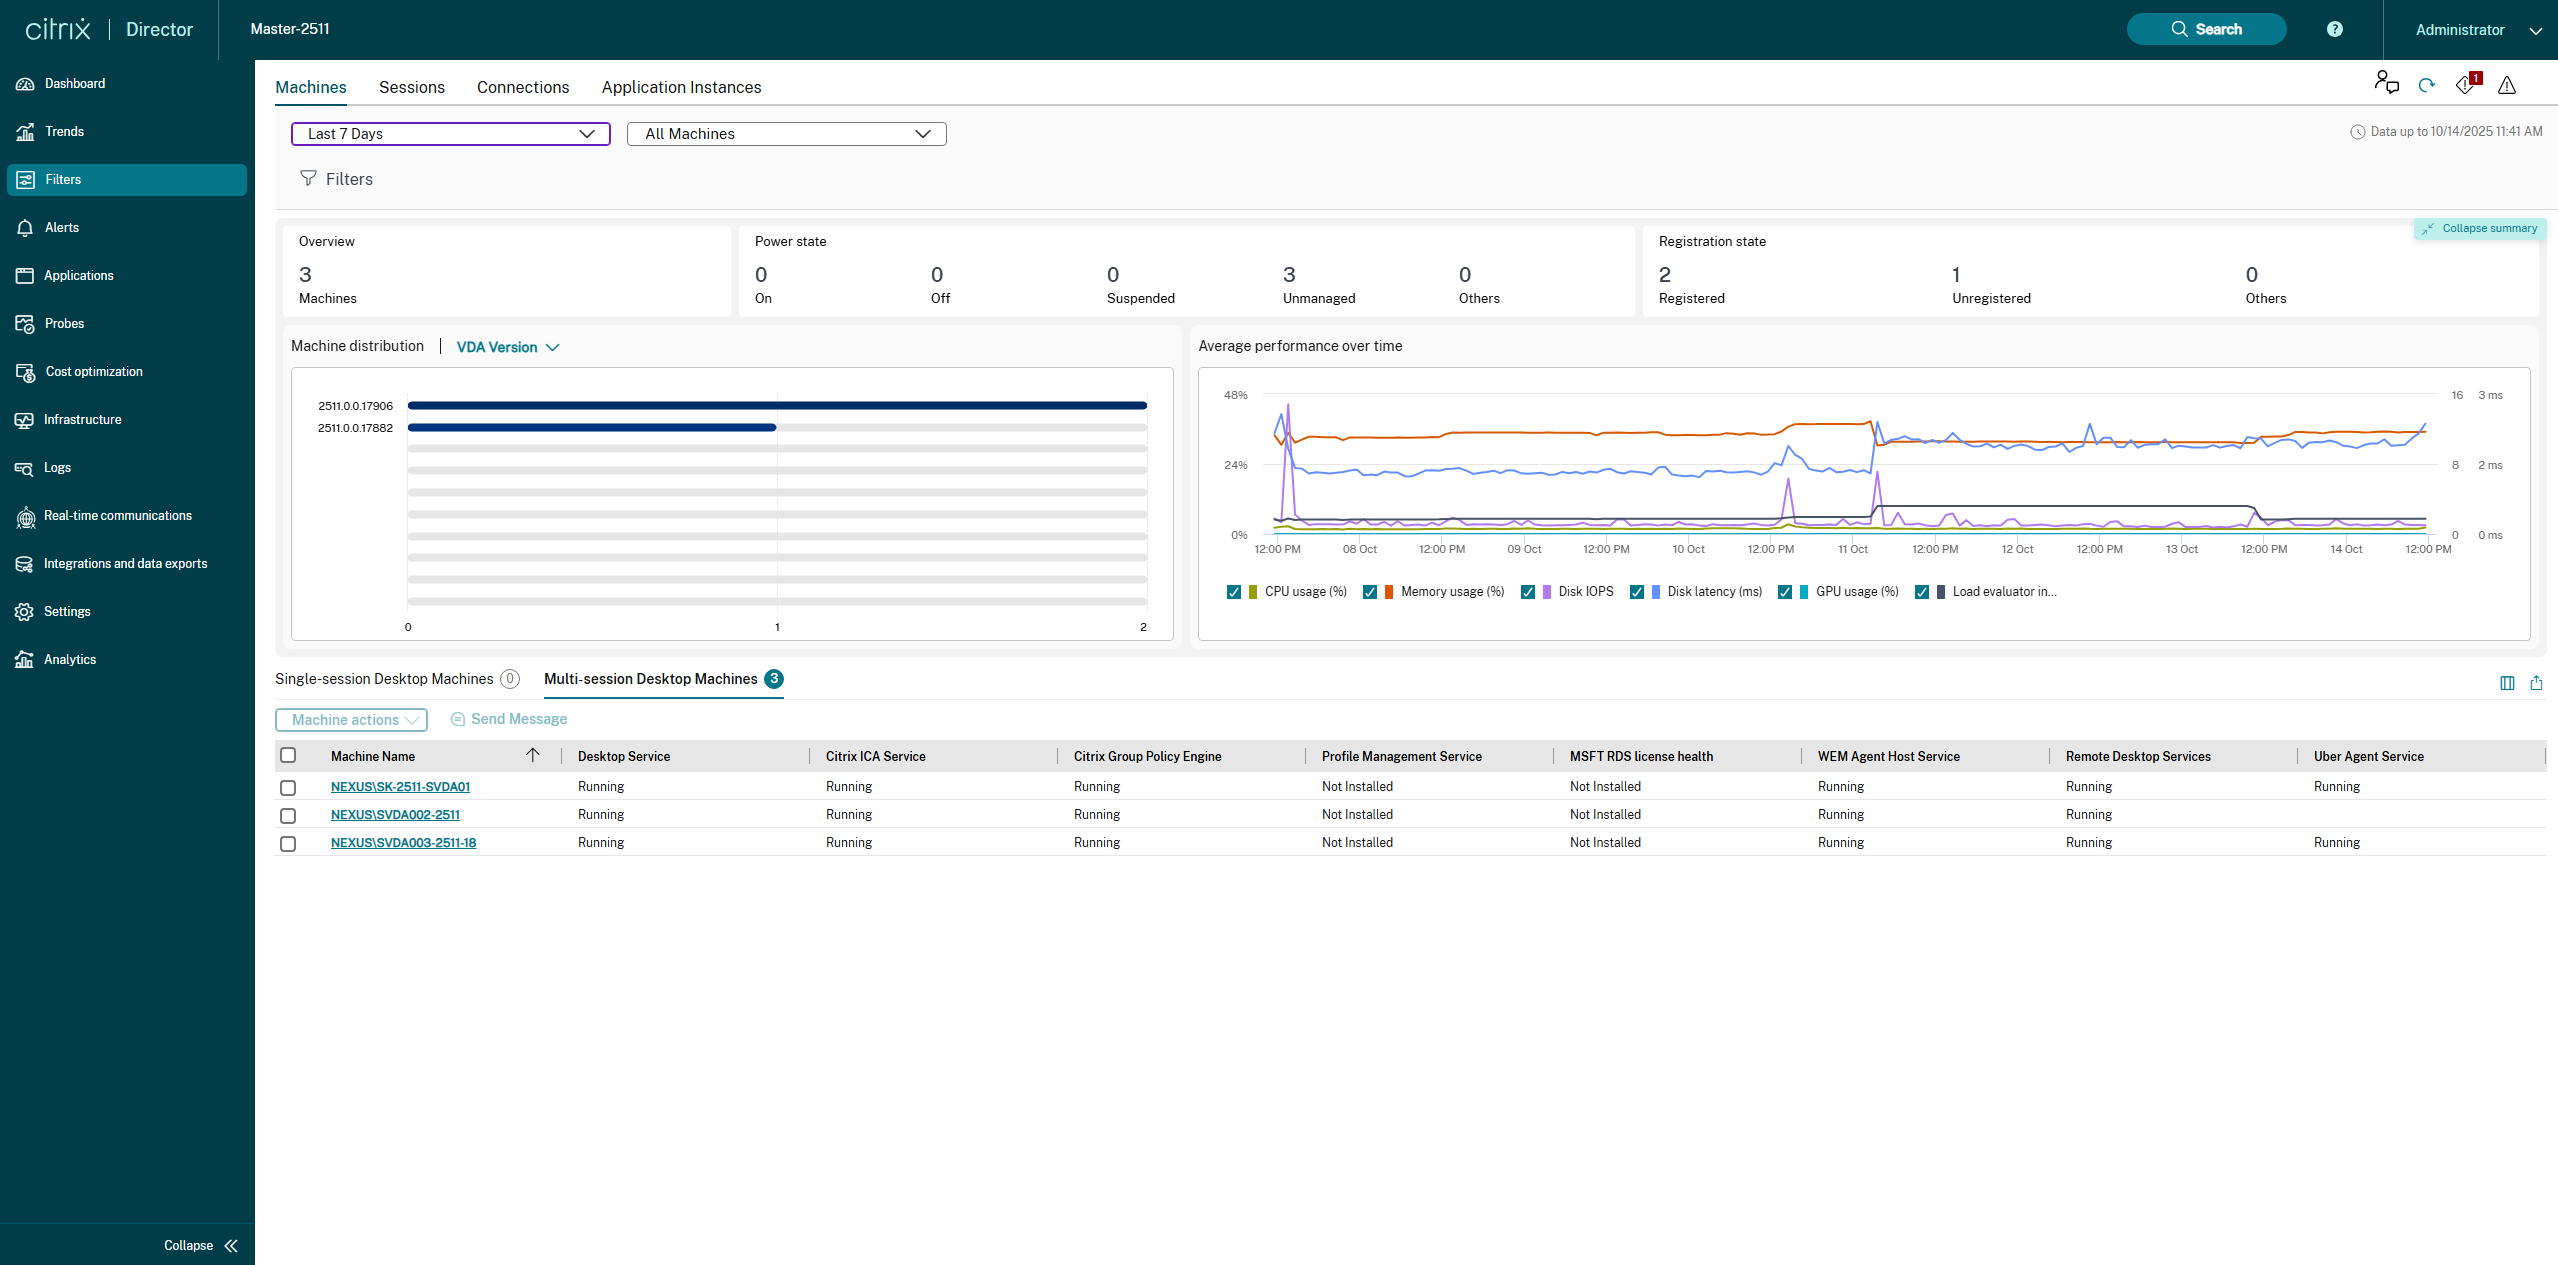
To provide richer insights into the health and performance of Virtual Delivery Agent (VDA) machines, we’ve introduced several key enhancements:
-
New Visualizations:
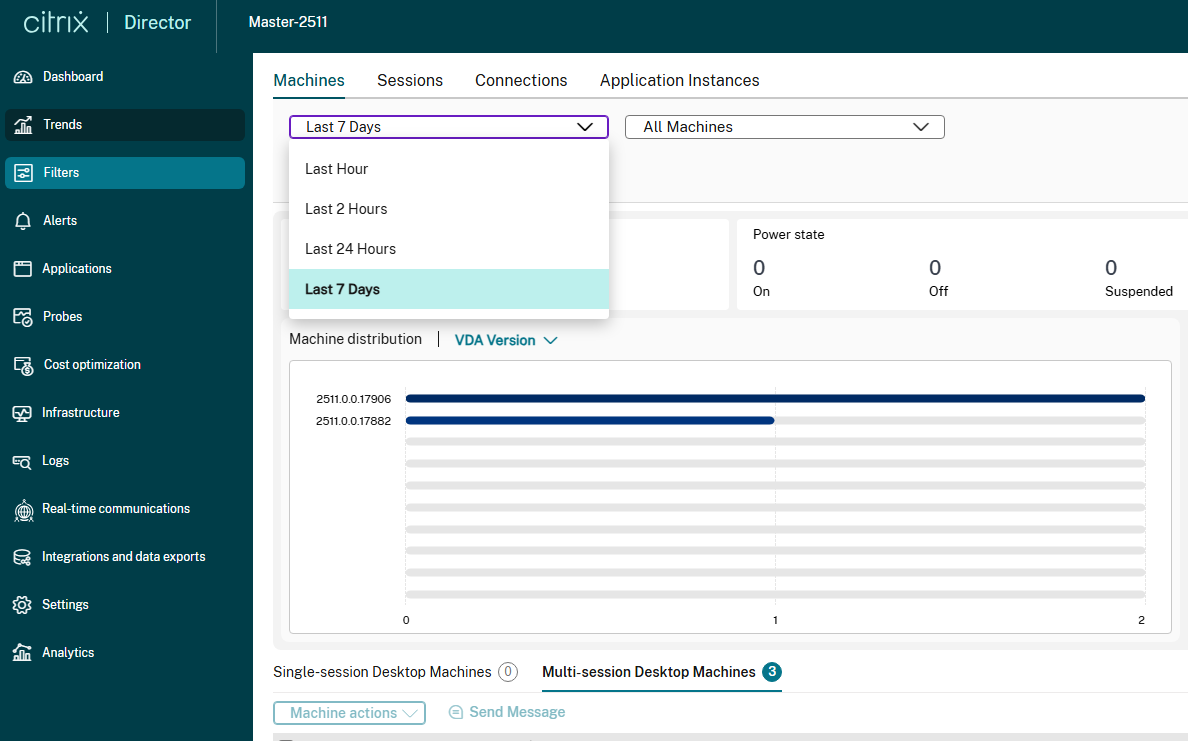
- A Summary Panel has been added with three categories: Overview, Power State and Registration State.
- Two new charts, Machine distribution and Average performance over time, have been added to provide an immediate, graphical view of machine’s status and historical trends.
-
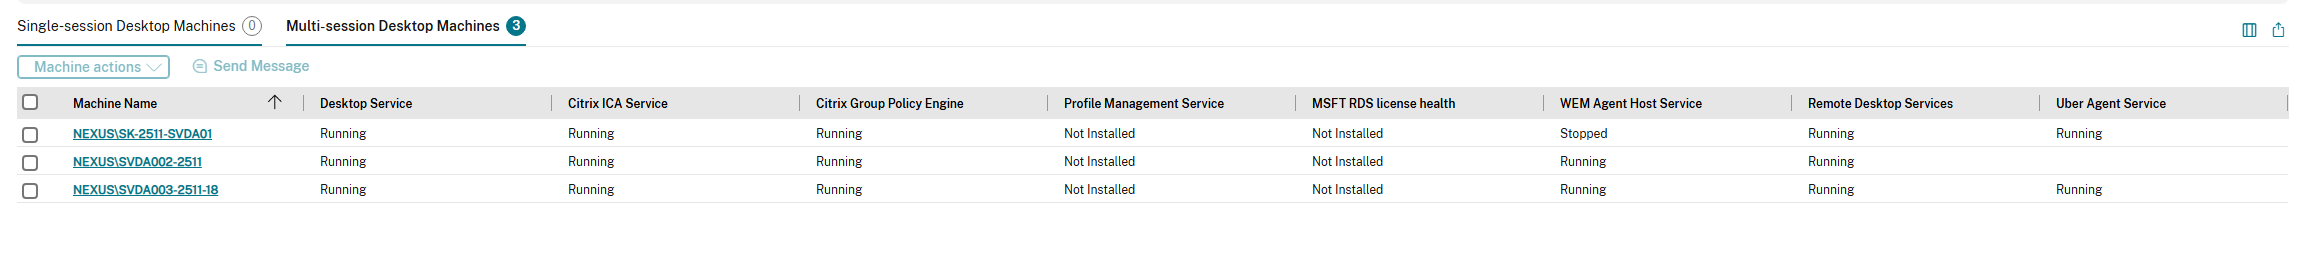
Enhanced Tabular Data: The Single-session and Multi-session Desktop Machines tables now include detailed status columns for critical VDA services, helping to quickly pinpoint the root cause of machine health issues.
-
New Time Range Filter: Two new time range filters - Last 2 Hours and Last 7 Days has been added to provide support for historical trends.
2. Understanding the New Visualizations
2.1. Summary Panel
-
Overview: Displays the total number of VDAs (Machines) associated.
-
Power State: Displays the number of machines based on their power states - On, Off, Suspended, Unmanaged and Others.
-
Registration State: Displays the number of machines based on their registration states - Registered, Unregistered and Others.
This summary is collapsible and helps admins to take neccessary actions based on the above seggreation like switching on machines which are in Off state or to identify which machines are in Unregistered states.
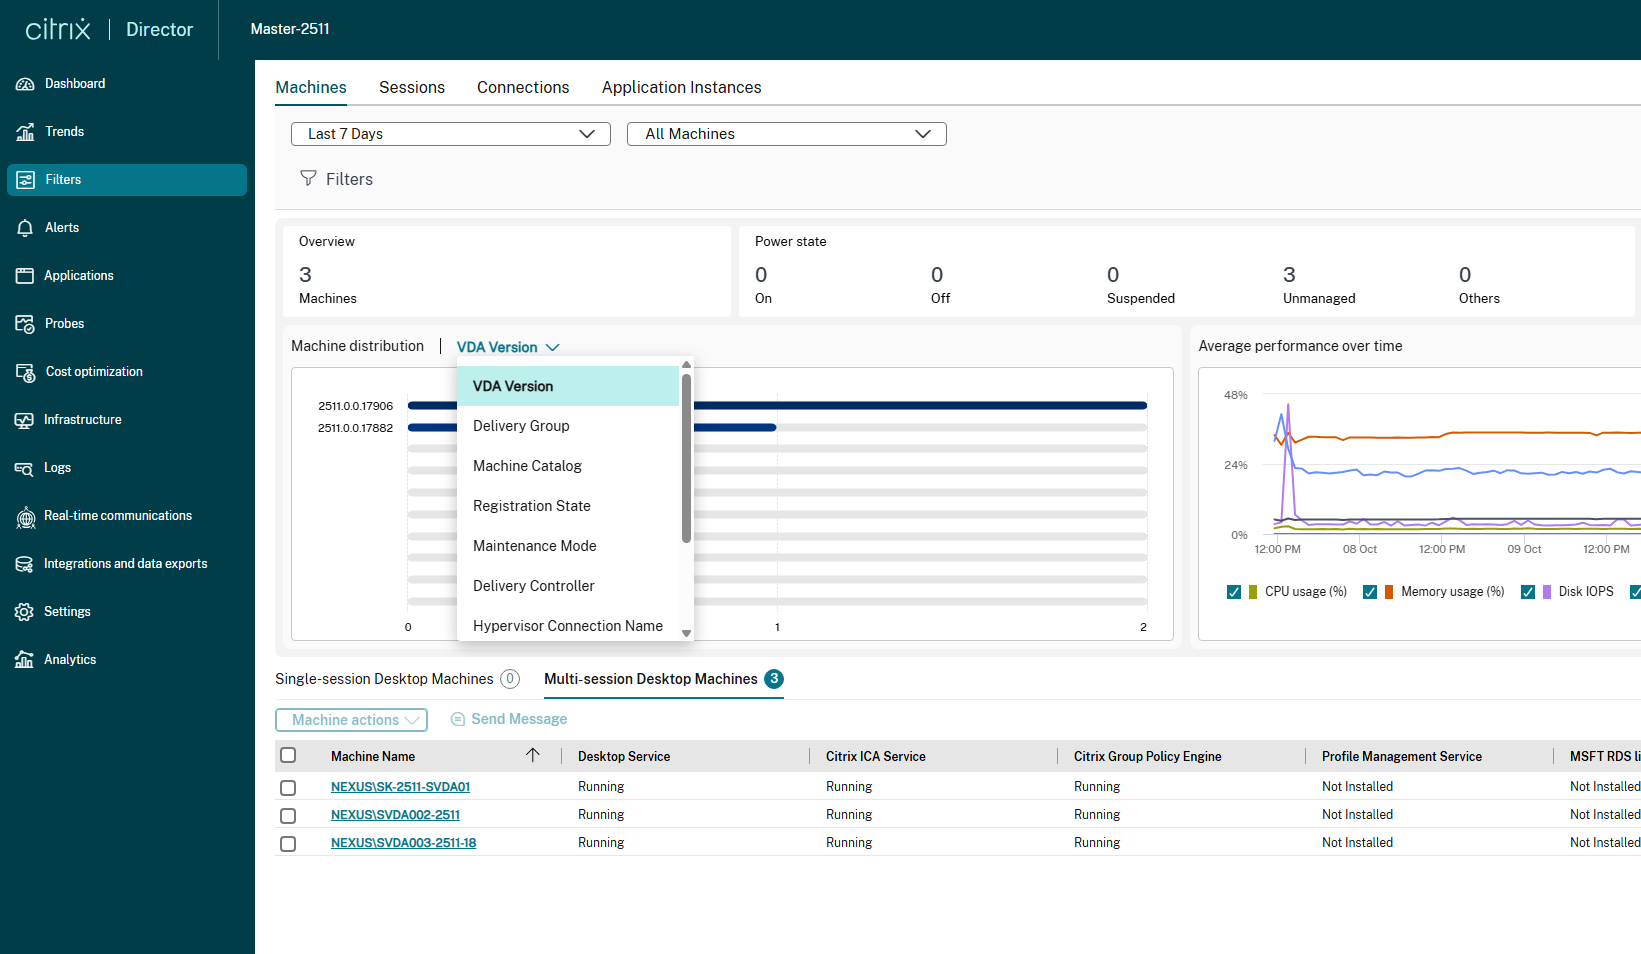
2.2. Machine Distribution
-
Purpose: This bar chart provides a quick, visual breakdown of the VDA machines included in the current filter set. The default filter is set to VDA Version. However the user can filter using Delivery Group, Machine Catalog, Registration State, Maintenance Mode, Delivery Controller, Hypervisor Connection Name, Failure Type, Failure Reason and Power State
-
Utility: This empowers admin to get the overall overview od the VDAs based on the filter criteria. For example, Machine Distribution on VDA Version helps administrators quickly identify if a significant portion of the VDAs is running an older or non-standard VDA version, which can be a prerequisite for troubleshooting or upgrade planning.
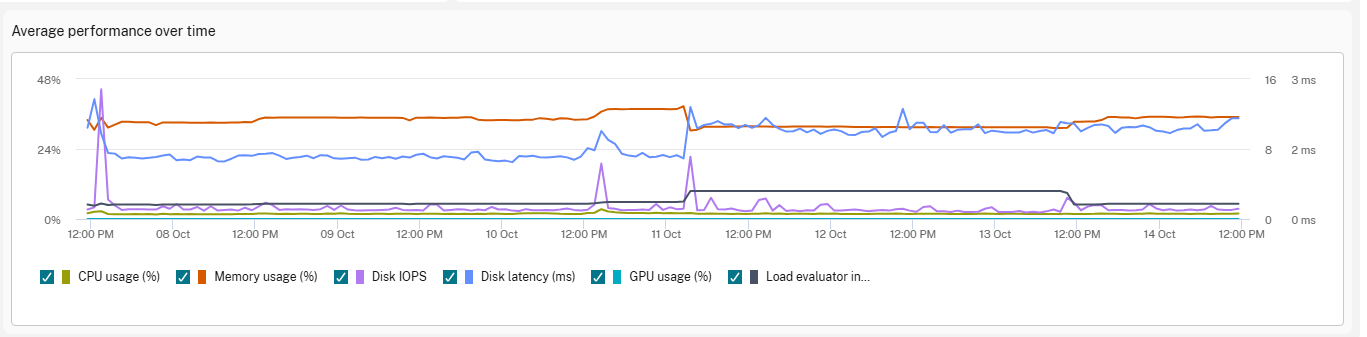
2.3. Average Performance Over Time
-
Purpose: This time-series chart tracks key performance metrics over the selected time range (e.g., Last 24 Hours).
-
Key Metrics Tracked:
- CPU usage (%): The average percentage of CPU being used.
- Memory usage (%): The average percentage of RAM being utilized.
- Disk IOPS: The average number of Input/Output Operations Per Second.
- Disk latency (ms): The average time delay (in milliseconds) for disk I/O requests.
- GPU usage (%): The average percentage of GPU being used (if applicable).
- Load Evaluator (%): The calculated load index percentage on the VDA machine.
-
Utility: Allows for historical trend analysis, helping to spot performance degradation, resource contention, and when peak loads occur.
3. Enhanced Tabular Data
Single/Multi-Session Table: New Column Definitions
| Column Name | Description | Possible Values |
|---|---|---|
| Desktop Service | Health status of the main service responsible for managing the desktop session (e.g., CtxSvcHost). | Running, Stopped, Not Installed, Paused, Start Pending, Stop Pending, Continue Pending, Pause Pending, Unknown |
| Citrix ICA Service | Health status of the core service that handles the Independent Computing Architecture (ICA) protocol for user sessions. | Running, Stopped, Not Installed, Paused, Start Pending, Stop Pending, Continue Pending, Pause Pending, Unknown |
| Citrix Group Policy Engine | Health status of the service responsible for processing and applying Citrix-specific policies. | Running, Stopped, Not Installed, Paused, Start Pending, Stop Pending, Continue Pending, Pause Pending, Unknown |
| Profile Management Service | Health status of the Citrix Profile Management that is used for managing user profiles in Citrix virtual environments. | Running, Stopped, Not Installed, Paused, Start Pending, Stop Pending, Continue Pending, Pause Pending, Unknown |
| MSFT RDS license health | Indicates the status of the Microsoft Remote Desktop Services (RDS) licensing check. | Running, Stopped, Not Installed, Paused, Start Pending, Stop Pending, Continue Pending, Pause Pending, Unknown |
| WEM Agent Host Service | Health status of the Workspace Environment Management (WEM) agent responsible for optimization and configuration. | Running, Stopped, Not Installed, Paused, Start Pending, Stop Pending, Continue Pending, Pause Pending, Unknown |
| Remote Desktop Services | Health status of the underlying Microsoft Remote Desktop Services (required for both single and multi-session host functionality). | Running, Stopped, Not Installed, Paused, Start Pending, Stop Pending, Continue Pending, Pause Pending, Unknown |
| Uber Agent Service | Health status of the third-party monitoring agent service (if applicable and installed). | Running, Stopped, Not Installed, Paused, Start Pending, Stop Pending, Continue Pending, Pause Pending, Unknown |
4. Support for new Time Range Filters
-
Last 2 Hours
-
Purpose: Provides a high-granularity, immediate view of VDA resource utilization over the last 120 minutes.
-
Utility: This short time frame is ideal for real-time troubleshooting. Use it to pinpoint the exact time a resource spike (like high CPU or low disk IOPS) occurred and correlate it with recent user activity or administrative actions.
-
-
Last 7 Days
-
Purpose: Displays resource usage and performance trends over the past week.
-
Utility: This is the standard filter for weekly performance review. It helps administrators identify recurring performance issues, such as specific days or peak hours (e.g., Monday morning logons) that consistently stress VDA resources, allowing for proactive capacity planning and optimization.
-
VDA Health Monitoring Metrics: Supported platforms and versions
| VDA Columns | Windows | Mac | Linux |
|---|---|---|---|
| Desktop Service | 2511 or above | 2511 or above | 2511 or above |
| Citrix ICA Service | 2511 or above | 2511 or above | 2511 or above |
| Citrix Group Policy Engine | 2511 or above | 2511 or above | 2511 or above |
| Profile Management Service | 2511 or above | 2511 or above | 2511 or above |
| MSFT RDS license health | 2511 or above | 2511 or above | 2511 or above |
| WEM Agent Host Service | 2511 or above | 2511 or above | 2511 or above |
| Remote Desktop Services | 2511 or above | 2511 or above | 2511 or above |
| Uber Agent Service | 2511 or above | 2511 or above | 2511 or above |