
SIEM integration
SecurSpaces can forward audit events to an external security information and event management (SIEM) system using Common Event Format (CEF) or newline-delimited JSON. Choose file output for a log shipper such as Filebeat, or standard output for an existing node logging agent.
The format and destination are independent. CEF with file output remains the default; JSON and standard output are opt-in settings.
Setting up the SIEM integration requires two phases: a backend deployment performed by the platform operator, followed by activation in the management console by a platform administrator.
Prerequisites
-
Access to the Citrix SecurSpaces™ Helm chart and
values.yamlconfiguration file -
Permission to deploy updates to the Kubernetes cluster hosting SecurSpaces
-
Platform administrator or security officer role in the SecurSpaces management console
-
A target SIEM system and collector that accept your chosen format
Caution:
Data security events can include raw, untruncated clipboard content in
data, even when isSecret is true. Neither CEF nor JSON redacts this content. Restrict access and retention in the destination. Standard output also exposes events to users with Kubernetes pods/log access. On Google Kubernetes Engine, exclude these events from a broadly accessible Cloud Logging _Default sink and route them to a restricted log bucket before enabling collection.
Phase 1: Configure the backend
Complete these steps in your deployment environment before activating the integration in the management console.
Option 1: Collect files with Filebeat
Configure
region.clusterConfig.syslog in your deployment values. The following example keeps CEF file output for the Filebeat configuration provided in the console:
region:
   clusterConfig:
     syslog:
       format: cef
       output: volume
       volumeName: "syslog-volume"
       volume:
         name: "syslog-volume"
         hostPath:
           path: "/strong-network/siem"
           type: DirectoryOrCreate
       mountPath: "/var/strong-network/"
       hostPath: "/strong-network/siem"
| Parameter | Description |
|---|---|
format |
cef (default) or json. Adapt the collector's parser if you change to JSON. |
output |
volume (default) or stdout. The volume parameters below aren't used with stdout. |
volumeName |
Name identifier for the Kubernetes volume. |
volume |
Kubernetes volume definition. The hostPath type maps a directory on the node's filesystem into the pod. DirectoryOrCreate tells Kubernetes to create the directory if it does not already exist. |
mountPath |
Path inside the platform service containers where the volume is mounted. The application writes .log files here (for example, /var/strong-network/<name>.log). |
hostPath |
Path on the host node where log files are persisted. Your log-shipping tool (for example, Filebeat) reads from this same path. |
The net effect: platform pods mount the host directory
/strong-network/siem at /var/strong-network/ inside the container and write .log files there. Filebeat (or your chosen tool) reads those same files via the host path.
Prepare the Filebeat configuration:
-
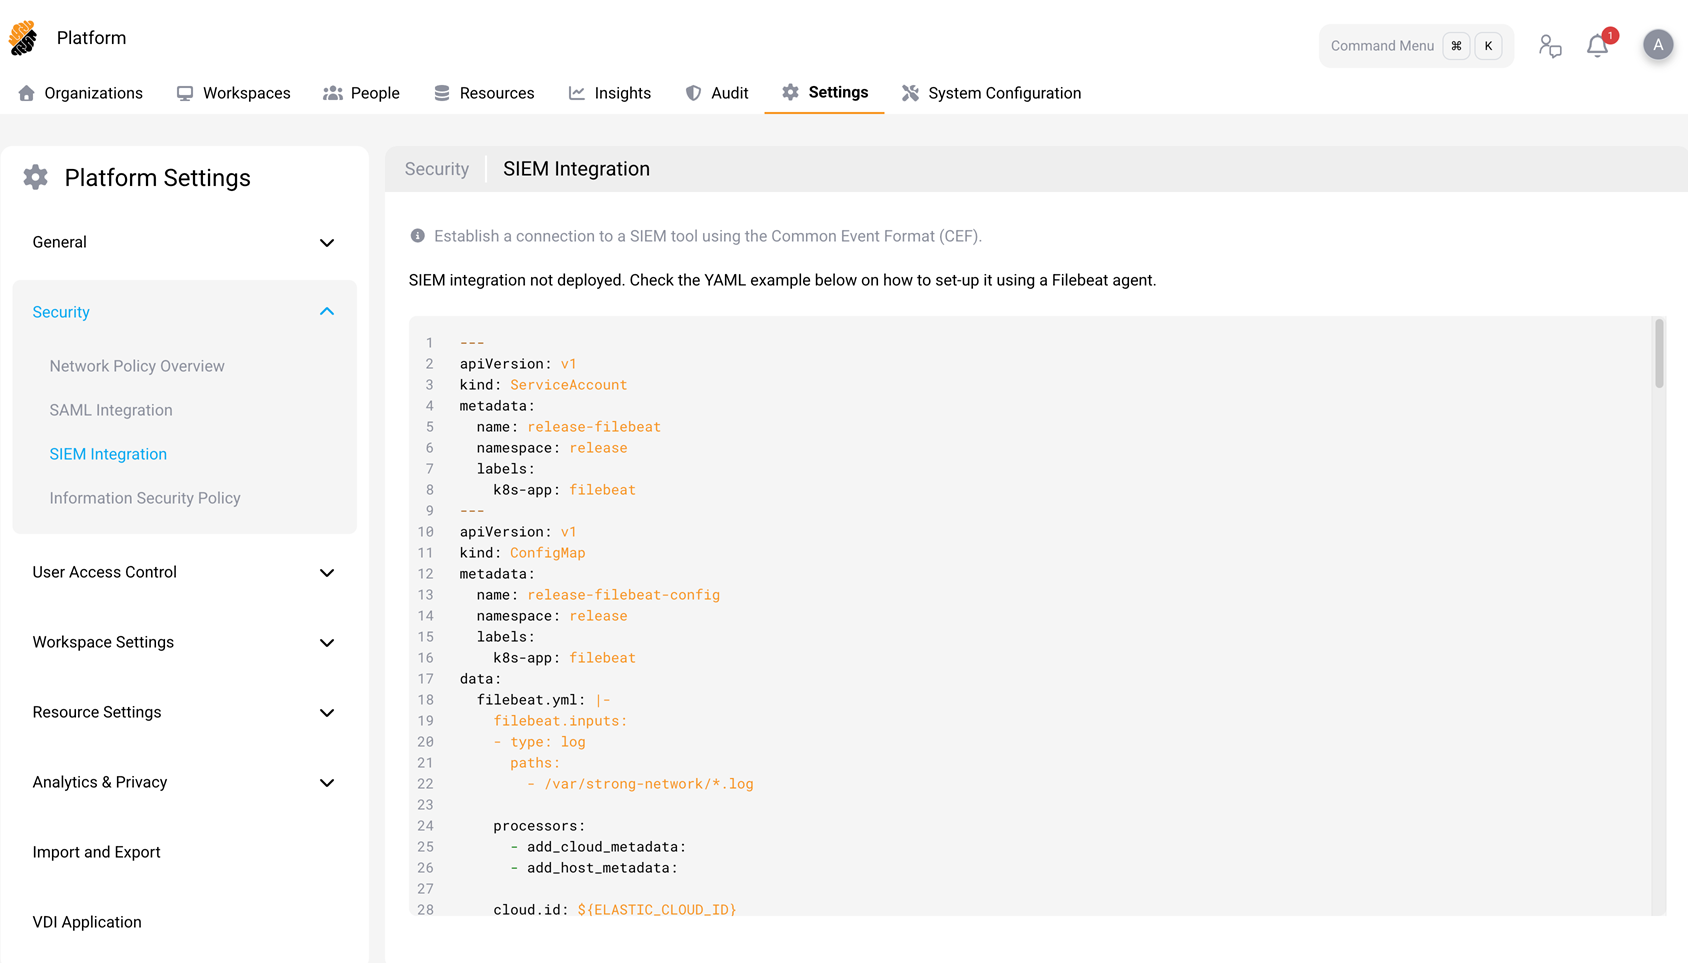
In the SecurSpaces management console, go to Platform > Settings > Security > SIEM Integration.
-
Copy the YAML example displayed on the page. This YAML defines a Filebeat deployment comprising a
ServiceAccount, aConfigMap(containing the Filebeat pipeline configuration), and aDaemonSet. -
In the copied YAML, replace every instance of
releasewith your actual deployment namespace. -
Fill in the Elasticsearch connection credentials in the environment variables section of the DaemonSet spec. For production deployments, store these credentials in a Kubernetes Secret and reference the Secret in the env vars rather than placing plain-text values in the YAML.
Place the updated YAML into your Helm charts and run a fresh deployment to apply the updated Helm configuration and the Filebeat DaemonSet to the cluster.
Option 2: Send JSON to standard output
Use this option when your cluster already collects container logs, such as with Google Kubernetes Engine Cloud Logging. You don't need the console's Filebeat example or a syslog host directory.
-
Configure your collector and restricted destination to accept newline-delimited JSON from platform pods.
-
Set the following Helm values:
region:
   clusterConfig:
     syslog:
       format: json
output: stdout -
Apply the updated deployment values through your normal Helm upgrade procedure.
-
Activate the integration in the console as described below.
With
output: stdout, the chart omits the syslog volume, mount, and permissions initialization container. Audit events appear as one JSON object per line, without a text logging prefix.
Phase 2: Activate in the management console
-
Sign in to the SecurSpaces management console as a platform administrator or security officer.
-
Go to Platform > Settings > Security > SIEM Integration.
-
Enable the integration toggle. It is available when the platform has a configured SIEM output. This confirms the platform-side setup, not delivery to your external log store.
Once activated, the platform begins forwarding audit events to the configured SIEM target.
How file collection works
-
SecurSpaces platform services write audit events as
.logfiles in CEF format to the container mount path (/var/strong-network/), which maps to/strong-network/siemon the host node. -
The Filebeat DaemonSet running on each cluster node reads log files from the host path (
/strong-network/siem). -
Filebeat ships the events to the configured SIEM target (for example, Elasticsearch).
JSON fields
JSON output contains the same event information as CEF, arranged for structured logging:
| Field | Description |
|---|---|
time |
Event time in UTC using RFC 3339 with fractional seconds, when available. |
severity |
INFO, WARNING, or ERROR, mapped from the numeric event severity. |
message |
Human-readable event name. |
deviceVendor, deviceProduct, deviceVersion |
Product identifiers; the version is included when available. |
deviceEventClassId, name |
Event category identifier, when available, and event name. |
eventSeverity |
Original numeric severity from 0 to 10. |
extensions |
Event-specific attributes, including user, project, workspace, and resource information. |
Google Cloud Logging can use the top-level time, severity, and message fields directly. Keep the
extensions object when forwarding events so that searches retain their event-specific context.
Audit events
The platform forwards events across eight categories. Every event is assigned a ClassID that identifies its category in the CEF payload.
For every event and its attributes, see Audit event catalog.
Common extensions
All events include the following CEF extensions:
| Extension | Description |
|---|---|
timestamp |
Time the event was generated. |
suid |
User ID of the actor. |
suser |
Username of the actor. |
wsid |
Workspace ID (when applicable). |
wsname |
Workspace name (when applicable). |
projectId |
Project ID. |
projectName |
Project name. |
eventId |
Unique identifier for the event. |
Event categories
Authentication (ClassID 1)
Login, Logout, SessionStart, SessionEnd, SessionInterrupt
Data Security (ClassID 3)
Copy, Paste, Cut, Upload, UploadLargeFile, Download, DownloadLargeFile, SupervisedCopy
Data security events include additional extensions:
data, isSecret, isCode.
System (ClassID 4)
WorkspaceSpecsUpdated
User Activity (ClassID 5)
VSCodeExtensionInstalled
Extension-install events include additional extensions:
extensionName, extensionId, extensionUUID.
Account Management (ClassID 6)
UserAddedToProject, UserRemovedFromProject, RoleChanged, UserCreated, UserDeleted, UserAddedAsSecurityOfficer, UserRemovedAsSecurityOfficer, UserAddedAsOrganizationOwner, UserRemovedAsOrganizationOwner, UserPasswordUpdated
Network Traffic (ClassID 7)
SSH Commands, External SSH Commands, HTTP Requests, Git-over-HTTP, TCP Forwarding, DNS Resolution
Resource Access (ClassID 8)
Actions: Created, Imported, ManuallyImported, Updated, SharedWithUsers, SharedPublicly, WorkspaceAttached, WorkspaceDetached, Deleted
Resources: repos, buckets, secrets, connectedServices, securityPolicy, images, credentials, mountPoints, workspaceApp, startupScript, workspaces, apiToken, personalSSH, vscodeVersions
Community Edition certificate events also use resource type
platformTlsCertificate with actions updated, rejected, and expiringSoon.
Severity mapping
Each event carries a CEF severity value (0–10). The platform maps severity to syslog priority as follows:
| CEF severity | Syslog priority |
|---|---|
| 0–3 | LOG_INFO |
| 4–6 | LOG_ALERT |
| 7–10 | LOG_CRIT |
For JSON output, severity 0–3 maps to
INFO, 4–6 to WARNING, and 7–10 to ERROR. The original number remains in eventSeverity.
Event filtering
You can control which events the platform forwards using two filters on the SIEM Integration settings page:
-
Severity filter — Sets a minimum severity threshold. Events below the threshold are not forwarded.
-
Event type filter — Selects specific event categories or individual event types to forward.
Verify the integration
After deployment, confirm that the pipeline is working end-to-end. For file collection:
-
Verify that the Filebeat pods are running:
kubectl get pods -n <namespace> -
Confirm that
.logfiles exist on the host path:ls /strong-network/siem/ -
Check the SIEM Integration page in the management console — the status should indicate that the integration is active.
-
Perform an auditable action in SecurSpaces, such as signing in or creating a workspace, and verify that the corresponding event appears in your SIEM tool.
For standard output:
-
Confirm that SIEM Integration is enabled and its filters include the action you will perform.
-
Sign in again or create a workspace to generate an audit event.
-
Inspect the logs of the platform service handling that action, using an account authorized to read sensitive logs:
kubectl logs -n <namespace> <platform-pod> -c <container> --since=5m -
Find the JSON event in your destination log store and confirm that its timestamp, severity, and extensions are preserved. If it appears only in pod logs, investigate the collector and destination.