
Workspace resource usage insights
Citrix SecurSpaces™ provides historical insights into workspace CPU and memory usage. This data is automatically collected and stored in the SecurSpaces database to support rightsizing analysis and long-term trend evaluation.
By leveraging this data, customers can:
-
Analyze CPU and memory consumption for each workspace over time.
-
Identify optimal resource allocation for workspaces.
-
Reduce infrastructure costs while maintaining a high-quality developer experience.
Requirements
To enable the collection of workspace metrics, the Kubernetes Metrics Server must be installed. This component aggregates resource usage data across Kubernetes clusters and is commonly deployed in cloud-hosted environments or any setup that uses autoscaling.
For installation instructions and additional details, see the Kubernetes Metrics Server documentation
Data collection and storage
SecurSpaces automatically consolidates the raw measurement data every five minutes and provides the following data points for the previous 5-minute interval:
-
Minimum, Maximum, Average, P50, P75, P95, and P99
Access workspace measurements
Workspace measurement data is available through the management console and via API.
Download from the management console
Platform administrators and security officers can download workspace measurements as a file from Platform Settings > Analytics & Privacy > System Analytics.
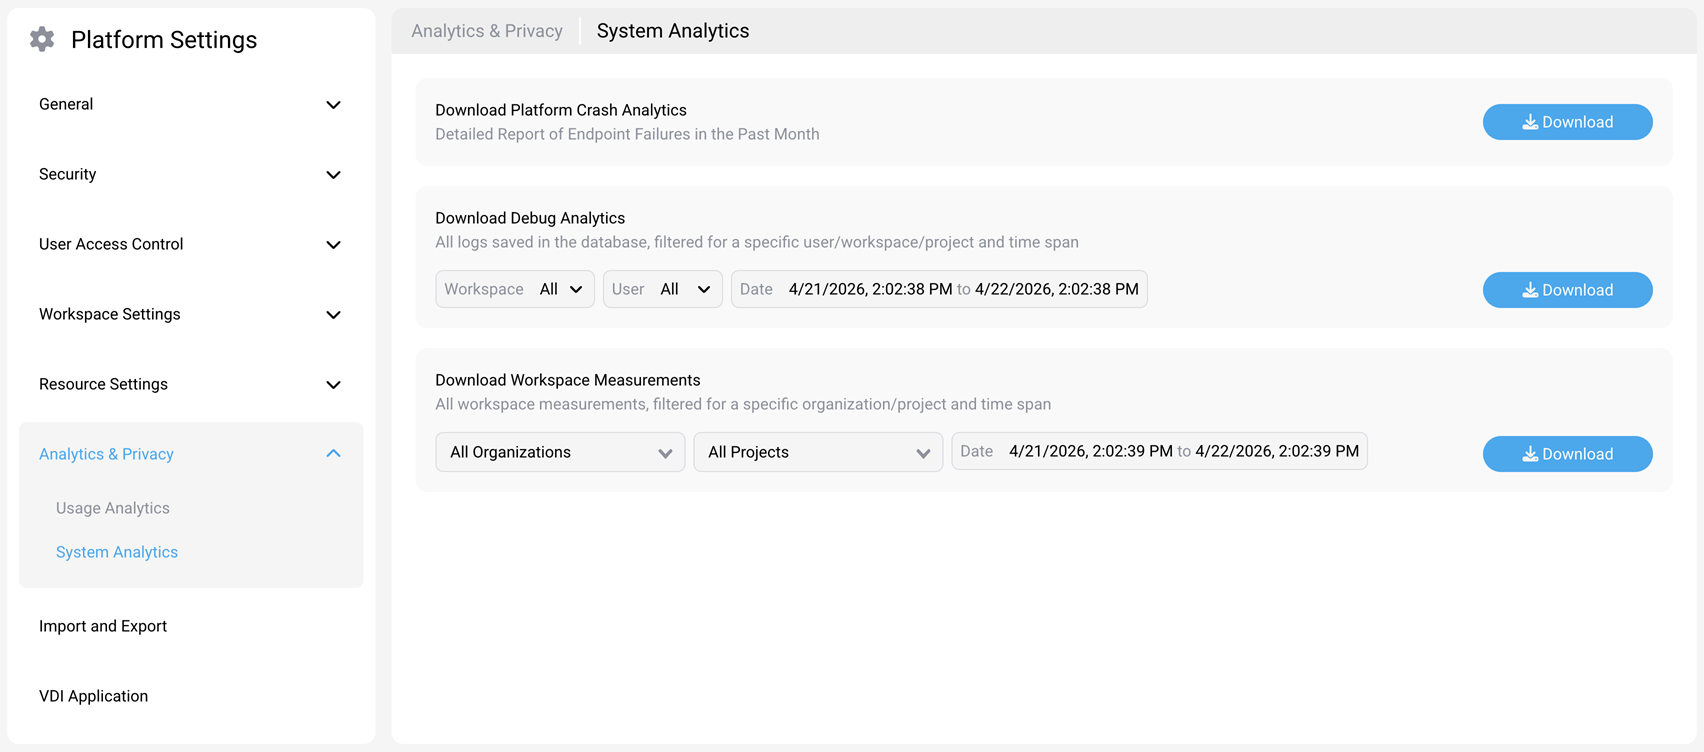
Available filters:
-
Organization — Select a specific organization or keep All Organizations to include data from every organization.
-
Project — Select a specific project or keep All Projects to include data from every project.
-
Date — Specify a start and end date, or select All Dates to download the complete measurement history.
To download workspace measurements:
-
Navigate to Platform Settings > Analytics & Privacy > System Analytics.
-
In the Download Workspace Measurements section, select an organization, project, and date range.
-
Select Download.
For more information about the System Analytics page, see System Analytics.
Access via API
Data is available in both raw and aggregated formats via API. Customers can access metrics at the platform, organization, and project levels.
-
For raw data, use the workspace-measurements-samples API (for example,
/v1/metrics/workspace-measurements-samples). -
For aggregated data, use the workspace-measurements API (for example,
/v1/projects/{projectId}/metrics/workspace-measurements).
For API documentation and usage examples, see the SecurSpaces API documentation.
Identify workspace ownership in Kubernetes
Workspace StatefulSets and their pod templates include ownership labels that external monitoring and inventory tools can use to attribute workloads. They identify the project, owner, and organization by numeric ID, not by display name.
| Label | Value |
|---|---|
strong.network/project-id |
Project ID |
strong.network/owner-id |
Workspace owner user ID |
strong.network/organization-id |
Organization ID, when available |
To inspect them, use a Kubernetes account with permission to list StatefulSets and pods in the workspace namespace:
-
List workspaces and their ownership labels:
kubectl get statefulsets,pods -n <namespace> \
-L strong.network/project-id,strong.network/owner-id,strong.network/organization-id -
To select a project's workloads, filter by its ID:
kubectl get statefulsets,pods -n <namespace> \
-l strong.network/project-id=<project-id> -
Use the same label names in your external monitoring or inventory tool.
New workloads receive the labels when deployed. Existing workloads receive them when rebuilt, including when resumed with outdated labels; upgrading the platform doesn't relabel every running workload at once. Zero or unavailable IDs are omitted. The labels describe ownership and don't grant access to a workspace or create billing records.