This content has been machine translated dynamically.
Dieser Inhalt ist eine maschinelle Übersetzung, die dynamisch erstellt wurde. (Haftungsausschluss)
Cet article a été traduit automatiquement de manière dynamique. (Clause de non responsabilité)
Este artículo lo ha traducido una máquina de forma dinámica. (Aviso legal)
此内容已经过机器动态翻译。 放弃
このコンテンツは動的に機械翻訳されています。免責事項
이 콘텐츠는 동적으로 기계 번역되었습니다. 책임 부인
Este texto foi traduzido automaticamente. (Aviso legal)
Questo contenuto è stato tradotto dinamicamente con traduzione automatica.(Esclusione di responsabilità))
This article has been machine translated.
Dieser Artikel wurde maschinell übersetzt. (Haftungsausschluss)
Ce article a été traduit automatiquement. (Clause de non responsabilité)
Este artículo ha sido traducido automáticamente. (Aviso legal)
この記事は機械翻訳されています.免責事項
이 기사는 기계 번역되었습니다.책임 부인
Este artigo foi traduzido automaticamente.(Aviso legal)
这篇文章已经过机器翻译.放弃
Questo articolo è stato tradotto automaticamente.(Esclusione di responsabilità))
Translation failed!
Session score metrics
Prerequisites
Session score via uberAgent lite is available from VDA version 2511 or later. The capability is also being backported to LTSR 2507 via CU2.
Overview
Session details now contain additional data-points to troubleshoot session performance and analyse overall session health. The additional data provides insights into the overall user-experience of individual sessions and help Admins understand the reason for poorly performing sessions.
-
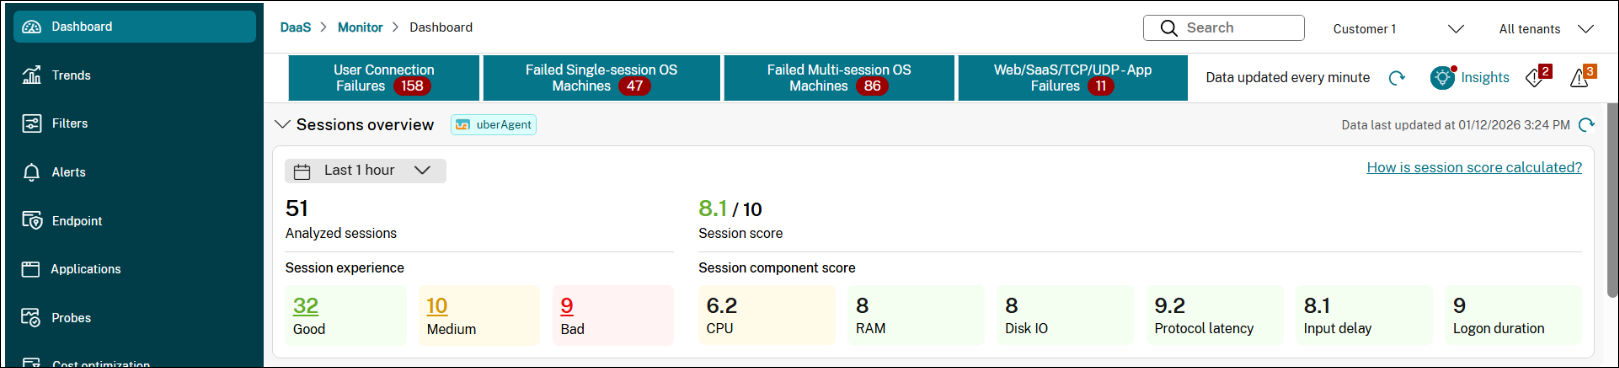
Session experience summary – It serves as a quick peek into the session experience. Shows the summary of user-experience across all the launched sessions within the environment during the selected time-period. Analysed sessions are categorised into Good, Medium, and Bad. Admins can click on an experience category to open the detailed session view (Filters page) with automatically applied filters.
-
Session and component score – Session summary also provides the average session and component score for the analysed session. While standalone average scores maybe not be a very useful metric, it can still serve as a good indicator of the session experience for majority sessions. Similarly, Admin can use the average component scores to understand the potential root cause of Bad sessions.
-
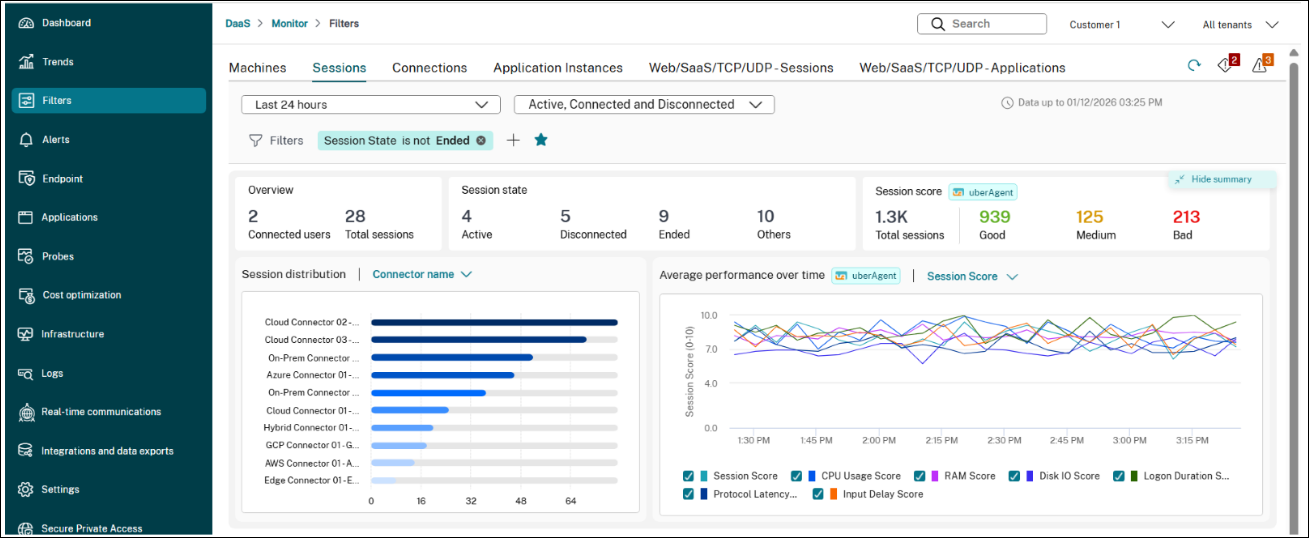
Session distribution – Session distribution chart is added on the filters page. Admin can view the session distribution by Endpoint Country, City, Endpoint OS, CWA version, ISP, etc.
-
Performance trends – Session performance trends chart is also added on the filters page. Performance chart is helpful for analysing the session and component performance trends and identify any recurring patterns based on time of day, country, etc.
-
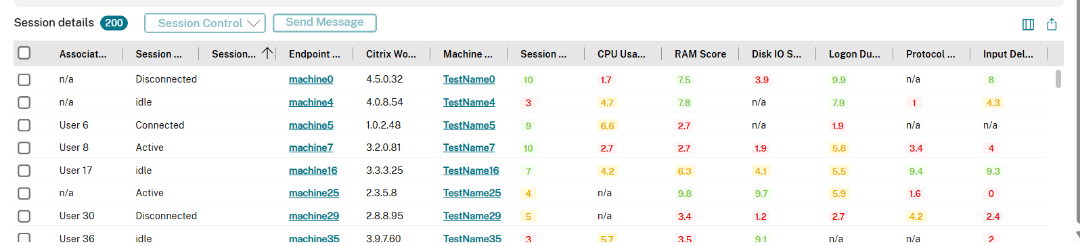
Individual session data – Following data points have been added for each session in the Session details table –
-
Session score
-
CPU score
-
RAM score
-
Disk IO score
-
Protocol Latency score
-
Input delay score
-
Logon duration score
-
Share
Share
In this article
This Preview product documentation is Citrix Confidential.
You agree to hold this documentation confidential pursuant to the terms of your Citrix Beta/Tech Preview Agreement.
The development, release and timing of any features or functionality described in the Preview documentation remains at our sole discretion and are subject to change without notice or consultation.
The documentation is for informational purposes only and is not a commitment, promise or legal obligation to deliver any material, code or functionality and should not be relied upon in making Citrix product purchase decisions.
If you do not agree, select I DO NOT AGREE to exit.