-
-
How to install and use JetBrains IntelliJ Gateway as a Citrix published application
-
Use Citrix Secure Access and Citrix Secure Developer Spaces with VS Code
-
Configure AI Gateway routing in Citrix Secure Developer Spaces
-
Configure external MongoDB with X.509 authentication in Citrix Secure Developer Spaces
-
This content has been machine translated dynamically.
Dieser Inhalt ist eine maschinelle Übersetzung, die dynamisch erstellt wurde. (Haftungsausschluss)
Cet article a été traduit automatiquement de manière dynamique. (Clause de non responsabilité)
Este artículo lo ha traducido una máquina de forma dinámica. (Aviso legal)
此内容已经过机器动态翻译。 放弃
このコンテンツは動的に機械翻訳されています。免責事項
이 콘텐츠는 동적으로 기계 번역되었습니다. 책임 부인
Este texto foi traduzido automaticamente. (Aviso legal)
Questo contenuto è stato tradotto dinamicamente con traduzione automatica.(Esclusione di responsabilità))
This article has been machine translated.
Dieser Artikel wurde maschinell übersetzt. (Haftungsausschluss)
Ce article a été traduit automatiquement. (Clause de non responsabilité)
Este artículo ha sido traducido automáticamente. (Aviso legal)
この記事は機械翻訳されています.免責事項
이 기사는 기계 번역되었습니다.책임 부인
Este artigo foi traduzido automaticamente.(Aviso legal)
这篇文章已经过机器翻译.放弃
Questo articolo è stato tradotto automaticamente.(Esclusione di responsabilità))
Translation failed!
Analytics
System Analytics
Use the System Analytics section to download detailed reports and logs for the Citrix Secure Developer Spaces™ (SDS) platform. Reports are available under Platform Settings > Analytics & Privacy > System Analytics.
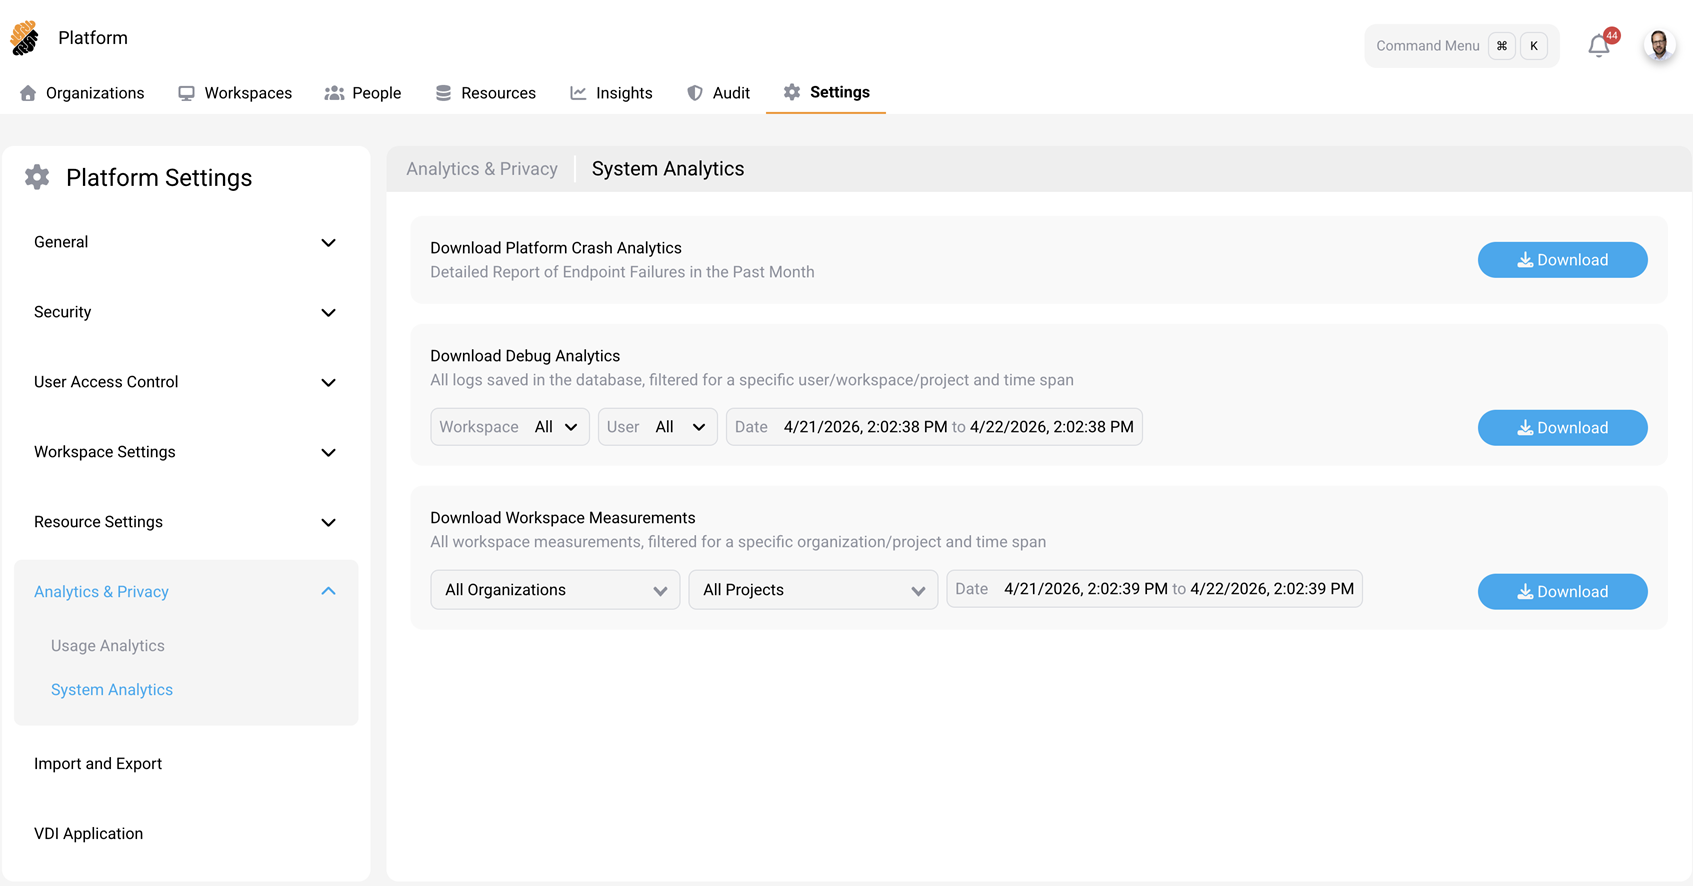
Download Platform Crash Analytics
Download a report of API and endpoint failures from the past 30 days. This report helps identify recurring errors and supports platform-level troubleshooting.
Download Debug Analytics
Download system logs filtered by workspace, user, or time range. Use this report for targeted troubleshooting and root-cause analysis.
Available filters:
- Workspace — Select a specific workspace or choose All to include all workspaces.
- User — Select a specific user or choose All to include all users.
- Date — Specify a start and end date for the report. An All Dates option is also available.
Download Workspace Measurements
Download workspace resource usage measurements across the platform. This report contains workspace measurement data that can be filtered by organization, project, and time range. Because measurement files can be large, the platform uses a WebSocket connection to facilitate the download.
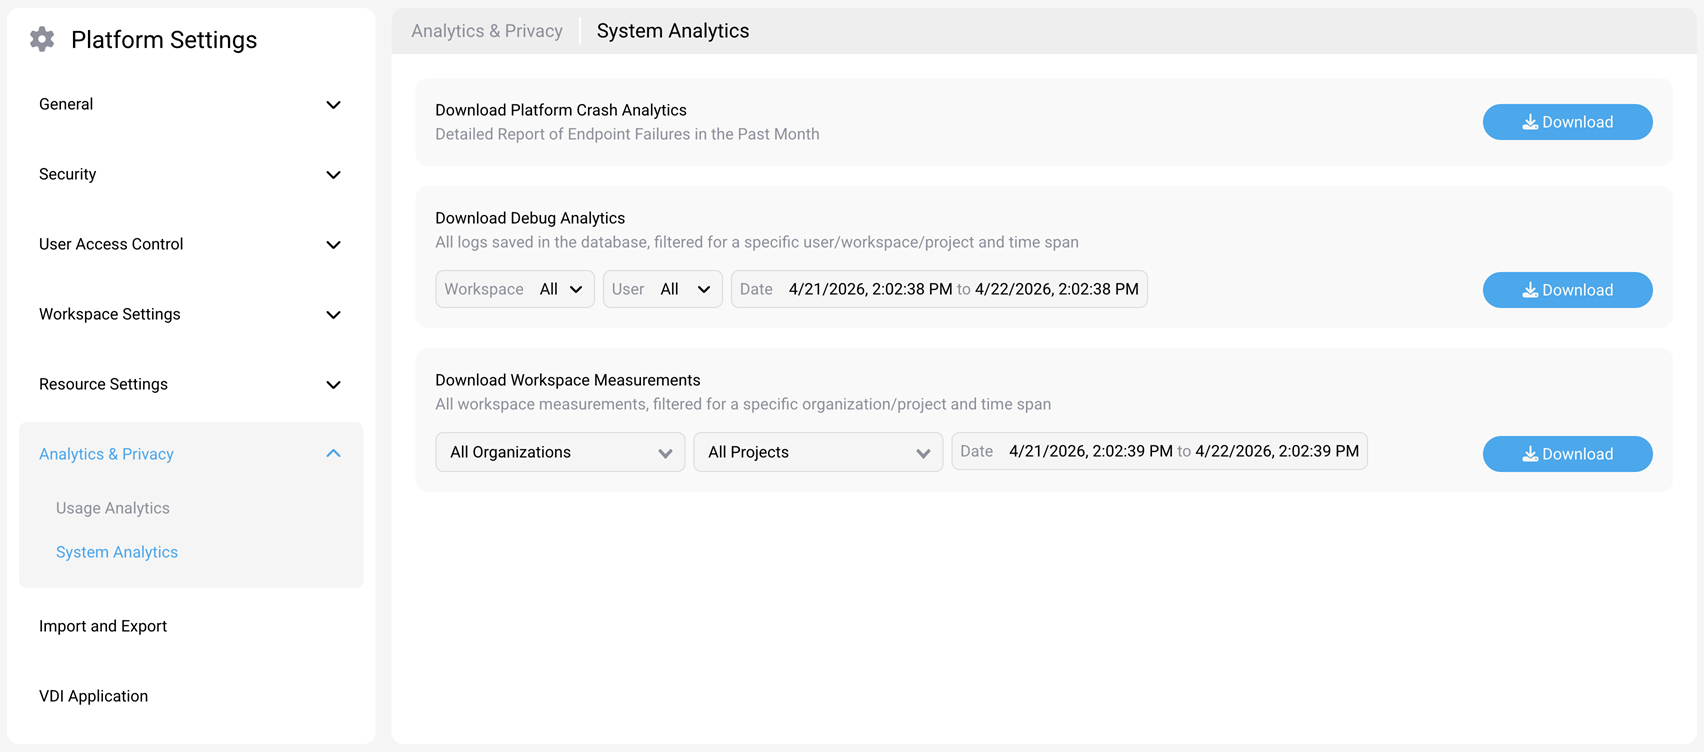
Available filters:
- Organization — Select a specific organization from the dropdown or keep All Organizations to include data from every organization. The dropdown supports a search to find an organization by name quickly.
- Project — Select a specific project or keep All Projects to include data from every project.
- Date — Specify a start and end date for the report, or select All Dates to download the complete measurement history.
To download workspace measurements:
- Navigate to Platform Settings > Analytics & Privacy > System Analytics.
- In the Download Workspace Measurements section, select an organization, project, and date range as needed.
- Select Download.
Note:
Only platform administrators and security officers can access the System Analytics page.
Usage Analytics
The SDS management console uses Pendo to deliver in-product notifications, feature announcements, and contextual guidance. It also collects product feedback and usage telemetry to help improve the platform experience.
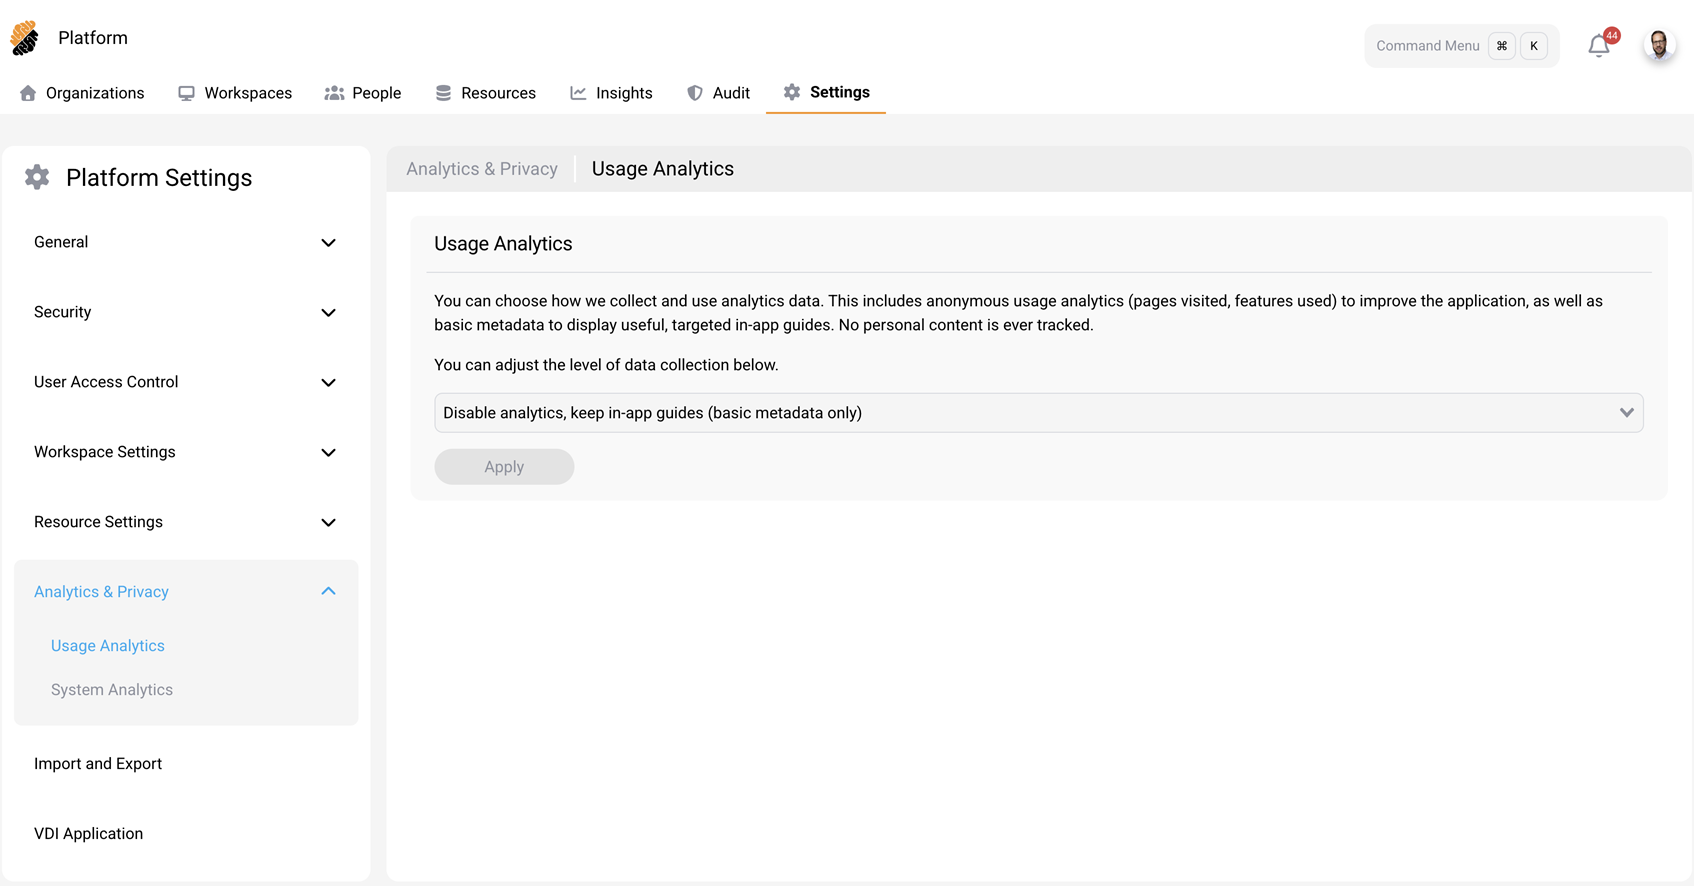
Data collection preferences
You can choose how analytics data is collected and used. This includes anonymous usage data (such as pages visited and features used) to improve the application, and basic metadata to enable targeted in-app guides. No personal content is ever tracked.
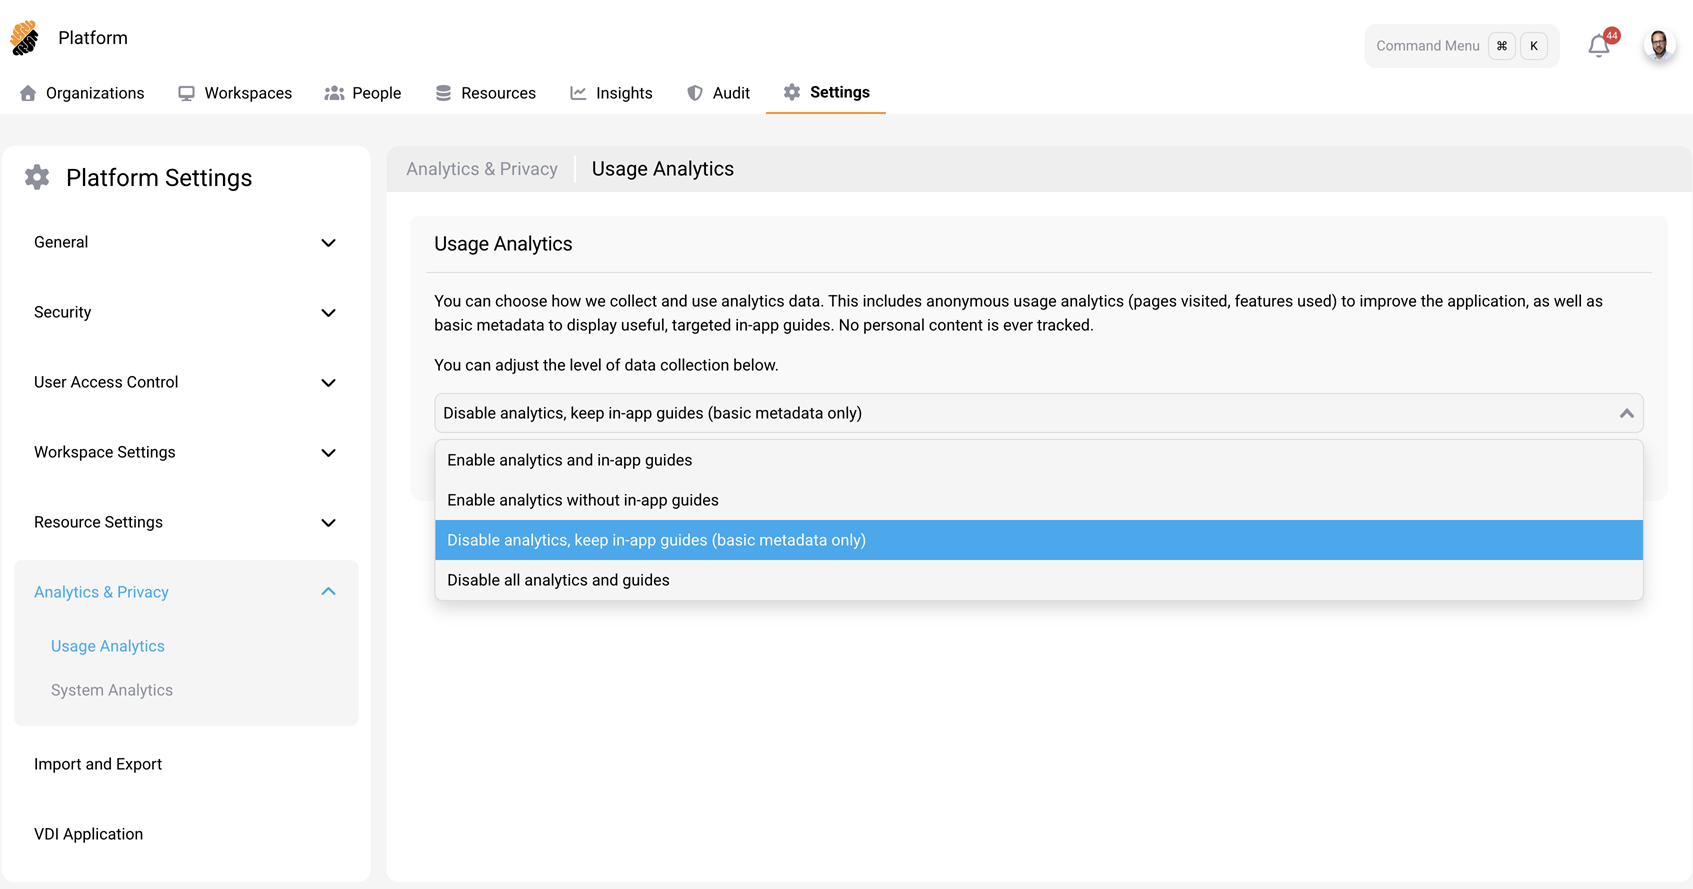
To change the data collection level, navigate to Platform Settings > Analytics & Privacy > Usage Analytics, select an option from the dropdown, and select Apply.
Available options:
- Enable analytics and in-app guides — This is the default. Usage telemetry is collected, and in-app guidance is displayed.
- Enable analytics without in-app guides — Usage telemetry is collected, but all in-app guidance overlays, prompts, and tooltips are suppressed.
- Disable analytics, keep in-app guides (basic metadata only) — No usage telemetry is shared with Citrix, but in-app guidance remains available.
- Disable all analytics and guides — All Pendo components are disabled, and no data is shared with Citrix. In-app guidance, notifications, and the ability to submit feedback are not available.
Connectivity requirements
To view Pendo content within the management console, ensure that the address http://citrix-sds-content.customer.pendo.io is reachable from your network.
Pendo is a third-party sub-processor that Citrix uses to provide cloud and support services to Citrix customers. For a complete list of sub-processors, see Sub-Processors for Citrix Cloud & Support Services and Citrix Affiliates.
Share
Share
This Preview product documentation is Citrix Confidential.
You agree to hold this documentation confidential pursuant to the terms of your Citrix Beta/Tech Preview Agreement.
The development, release and timing of any features or functionality described in the Preview documentation remains at our sole discretion and are subject to change without notice or consultation.
The documentation is for informational purposes only and is not a commitment, promise or legal obligation to deliver any material, code or functionality and should not be relied upon in making Citrix product purchase decisions.
If you do not agree, select I DO NOT AGREE to exit.