This content has been machine translated dynamically.
Dieser Inhalt ist eine maschinelle Übersetzung, die dynamisch erstellt wurde. (Haftungsausschluss)
Cet article a été traduit automatiquement de manière dynamique. (Clause de non responsabilité)
Este artículo lo ha traducido una máquina de forma dinámica. (Aviso legal)
此内容已经过机器动态翻译。 放弃
このコンテンツは動的に機械翻訳されています。免責事項
이 콘텐츠는 동적으로 기계 번역되었습니다. 책임 부인
Este texto foi traduzido automaticamente. (Aviso legal)
Questo contenuto è stato tradotto dinamicamente con traduzione automatica.(Esclusione di responsabilità))
This article has been machine translated.
Dieser Artikel wurde maschinell übersetzt. (Haftungsausschluss)
Ce article a été traduit automatiquement. (Clause de non responsabilité)
Este artículo ha sido traducido automáticamente. (Aviso legal)
この記事は機械翻訳されています.免責事項
이 기사는 기계 번역되었습니다.책임 부인
Este artigo foi traduzido automaticamente.(Aviso legal)
这篇文章已经过机器翻译.放弃
Questo articolo è stato tradotto automaticamente.(Esclusione di responsabilità))
Translation failed!
Cloud Connector advanced health checks - Deprecated
Note:
Cloud Connector Health Metrics and Alerts have been added to Citrix DaaS™ Infrastructure Monitoring. This should be the primary location for analyzing and troubleshooting issues proactively regarding your infrastructure.
For more information see Infrastructure Monitoring.
Before and after updates, Cloud Connectors perform health checks to ensure that updates cause no unnecessary downtime for providers. You can see the connectivity and health status of the Connector and of each service or provider on the Connector.
View Connector health check data
- From the Citrix Cloud™ menu, select Resource Locations.
- Select the Connector for which you want to view health check data.
- On the Connectors page, go to the ellipsis menu next to the Connector and select View Connector data.
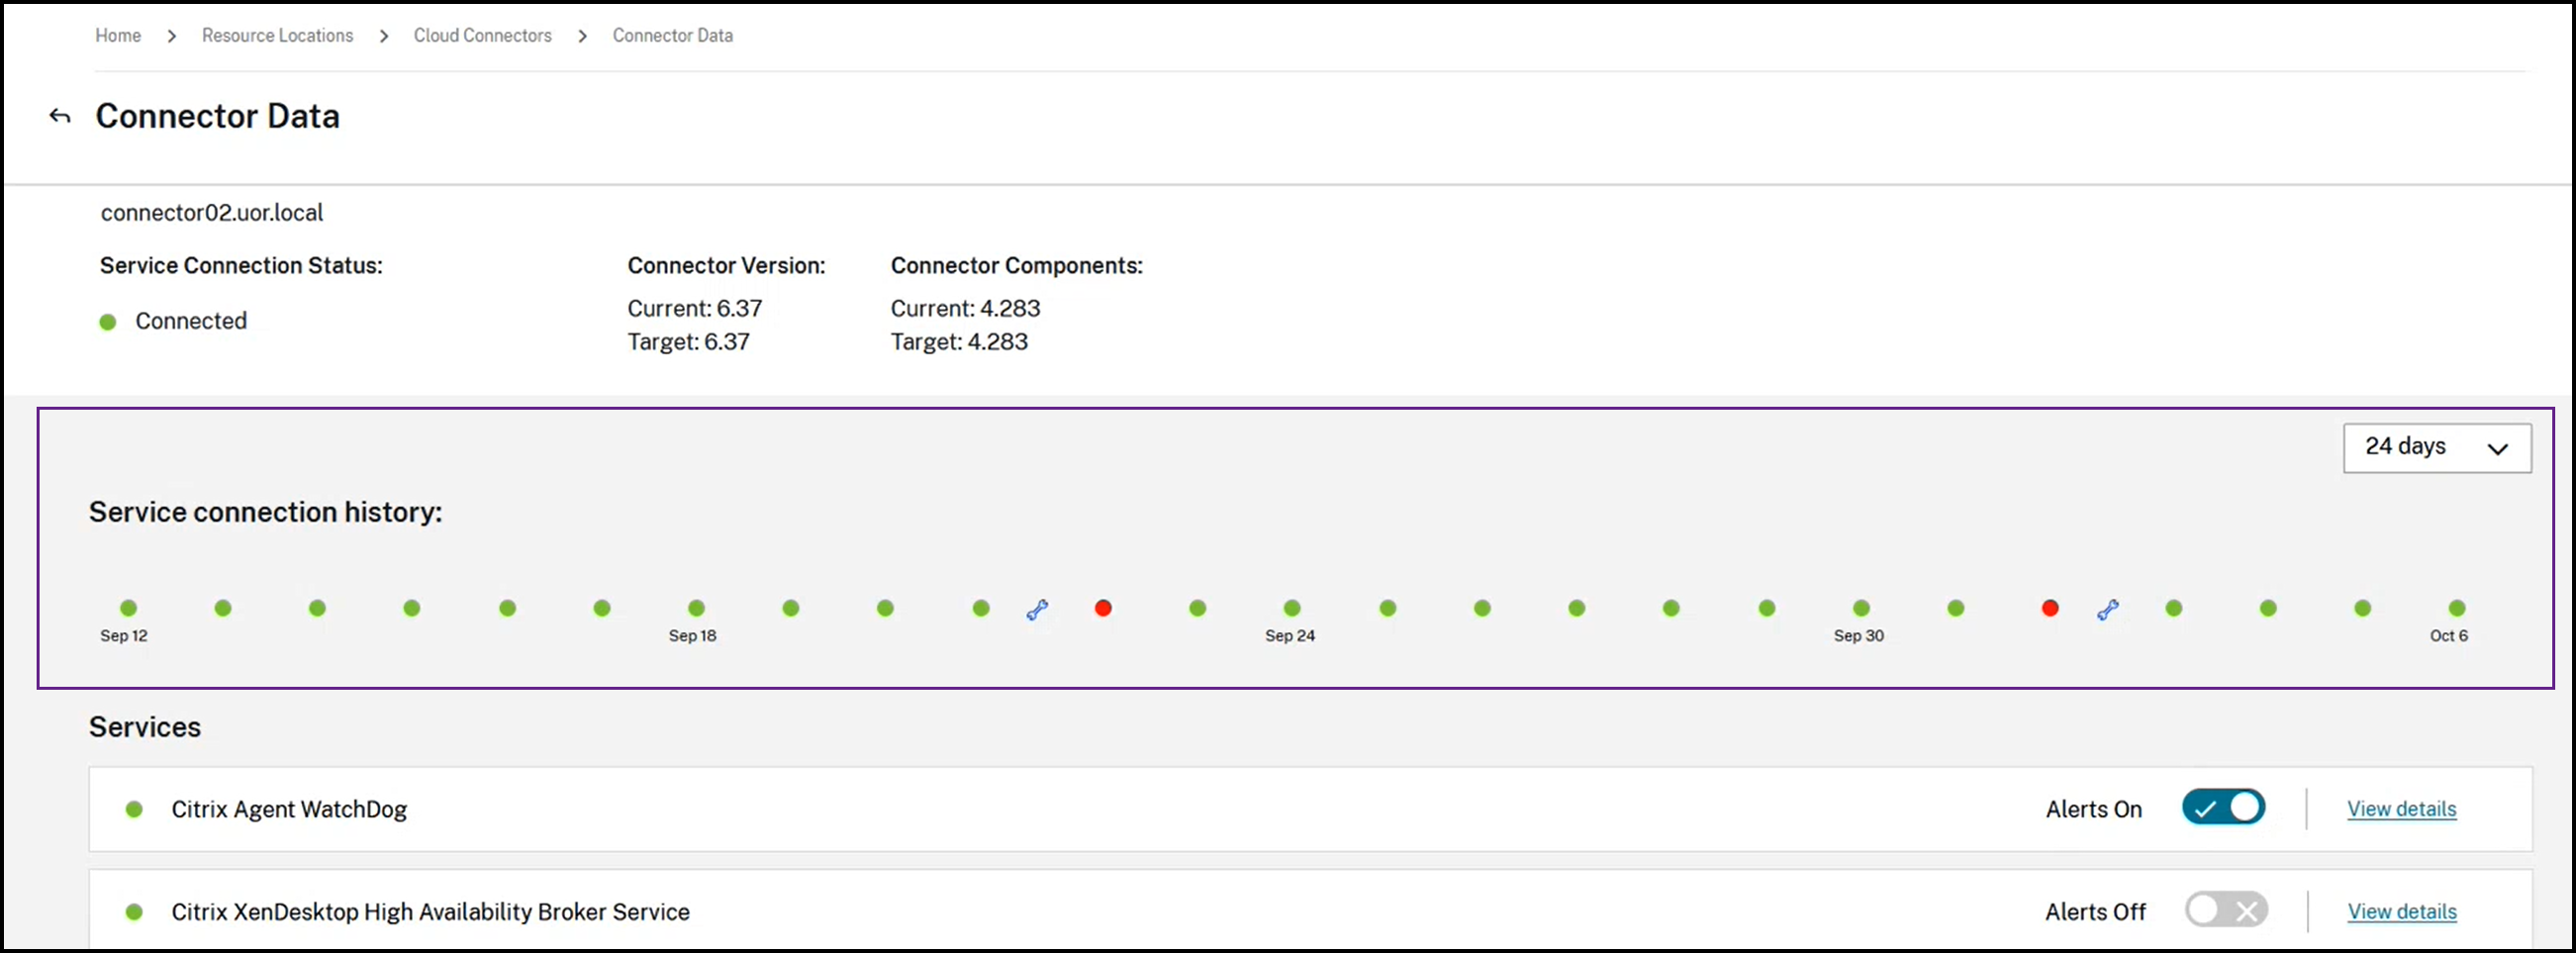
The Connector Data page appears, showing the following information.
-
Service Connection Status. This area of the Connector data page shows:
-
Whether your Connector is connected to the Cloud
-
For the Connector and its components, the currently installed version and the target version to be installed in the next update
-
-
Service connection history. 24 status indicators show the health status of the Connector over time. By default, service connection history shows status for the previous 24 hours, in one-hour intervals. To see more history, select 24 days from the drop-down menu. The view shows status for the previous 24 days, in one-day intervals.
- A green dot indicates healthy status during the time interval.
- A red dot indicates a failure or exception status during the time interval. Hover over the dot for more information.
- A wrench icon indicates that an update occurred during the time interval. Hover over the wrench icon for more information.
- A gray dot indicates that no health status information was received during the time interval.
-
Services. This area lists each service running on the Connector.
- The dot next to each service indicates the current status of the service.
- Use Alerts On and Alerts Off to control whether you are notified of alerts from the service. If alerts are set to On, failures in the service cause a failure in the overall Connector connection status.
- Select View Details to view details of health status the service over time.
- Connector Metrics. This area shows Connector usage of memory usage, CPU, network data, and disks space for the previous 24 hours or 24 days. Use the drop-down menu in the Service connection history area to control the time period shown.
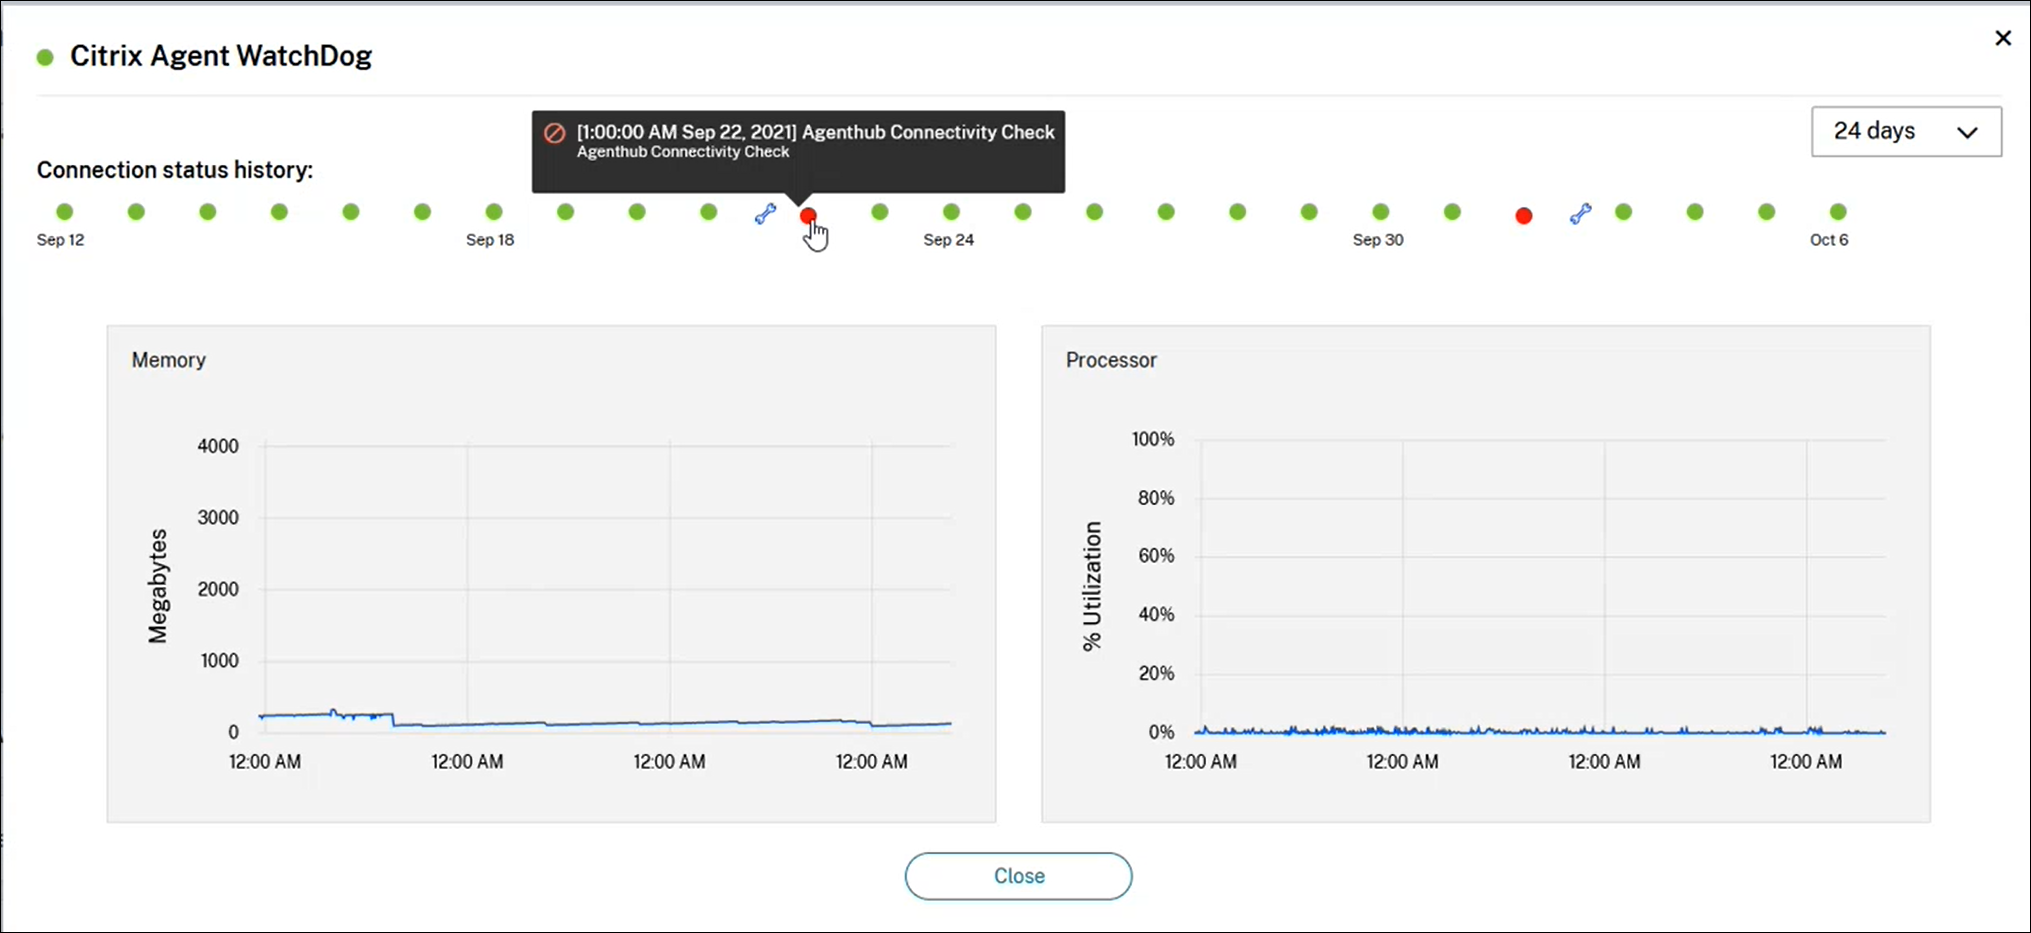
View service details
To view connection status history and metric for each service:
-
Use the drop-down menu in the Service connection history section to select the time period. You can view the previous 24 hours, in one-hour intervals, or the previous 24 days, in one-day intervals.
-
On the Connector Data page, select View Details next to the service.
The page that appears shows:
- 24 status indicators that show the health status of the service over time.
- A green dot indicates healthy status during the time interval.
- A red dot indicates a failure or exception status during the time interval. Hover over the dot for more information.
- A wrench icon indicates that an update occurred during the time interval. Hover over the wrench icon for more information.
- A gray dot indicates that no health status information was received during the time interval.
-
Charts that show memory and processor usage for the service during the specified time period.
Share
Share
In this article
This Preview product documentation is Citrix Confidential.
You agree to hold this documentation confidential pursuant to the terms of your Citrix Beta/Tech Preview Agreement.
The development, release and timing of any features or functionality described in the Preview documentation remains at our sole discretion and are subject to change without notice or consultation.
The documentation is for informational purposes only and is not a commitment, promise or legal obligation to deliver any material, code or functionality and should not be relied upon in making Citrix product purchase decisions.
If you do not agree, select I DO NOT AGREE to exit.