-
-
Connector Appliance for Cloud Services
-
Connector Appliance Network Connectivity Probe
-
This content has been machine translated dynamically.
Dieser Inhalt ist eine maschinelle Übersetzung, die dynamisch erstellt wurde. (Haftungsausschluss)
Cet article a été traduit automatiquement de manière dynamique. (Clause de non responsabilité)
Este artículo lo ha traducido una máquina de forma dinámica. (Aviso legal)
此内容已经过机器动态翻译。 放弃
このコンテンツは動的に機械翻訳されています。免責事項
이 콘텐츠는 동적으로 기계 번역되었습니다. 책임 부인
Este texto foi traduzido automaticamente. (Aviso legal)
Questo contenuto è stato tradotto dinamicamente con traduzione automatica.(Esclusione di responsabilità))
This article has been machine translated.
Dieser Artikel wurde maschinell übersetzt. (Haftungsausschluss)
Ce article a été traduit automatiquement. (Clause de non responsabilité)
Este artículo ha sido traducido automáticamente. (Aviso legal)
この記事は機械翻訳されています.免責事項
이 기사는 기계 번역되었습니다.책임 부인
Este artigo foi traduzido automaticamente.(Aviso legal)
这篇文章已经过机器翻译.放弃
Questo articolo è stato tradotto automaticamente.(Esclusione di responsabilità))
Translation failed!
Connector Appliance Network Connectivity Probe
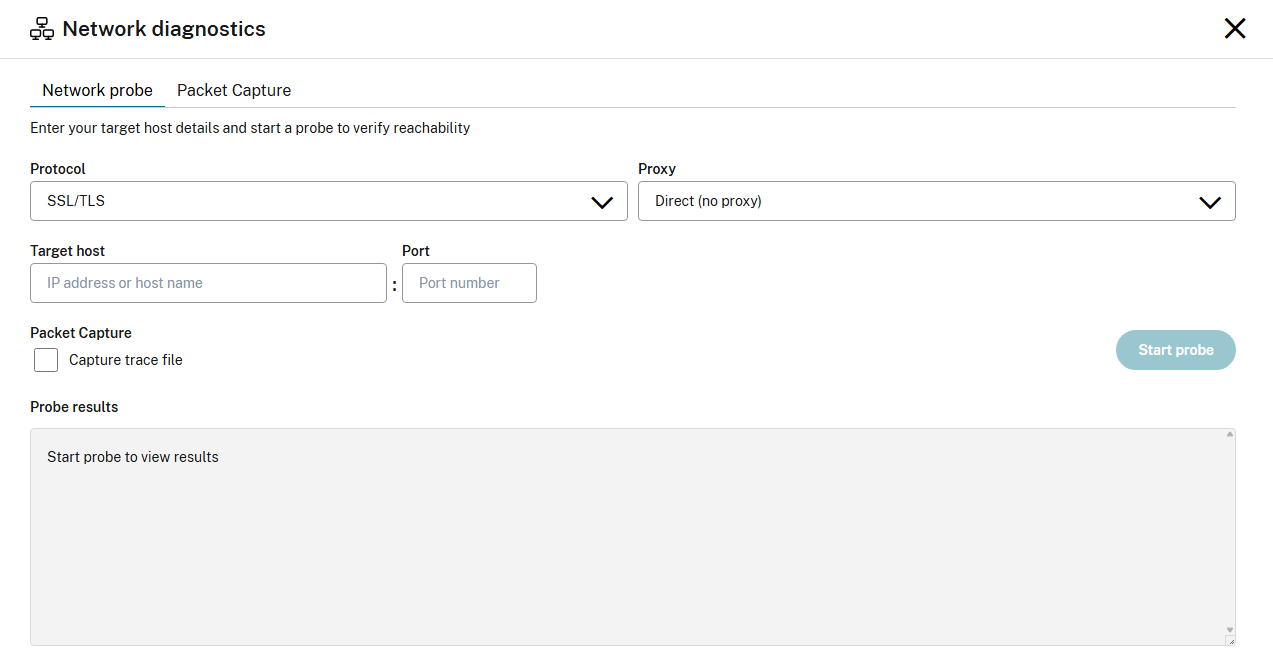
The Connector Appliance Network Connectivity Probe allows the user to perform an on-demand connectivity check of a network target.
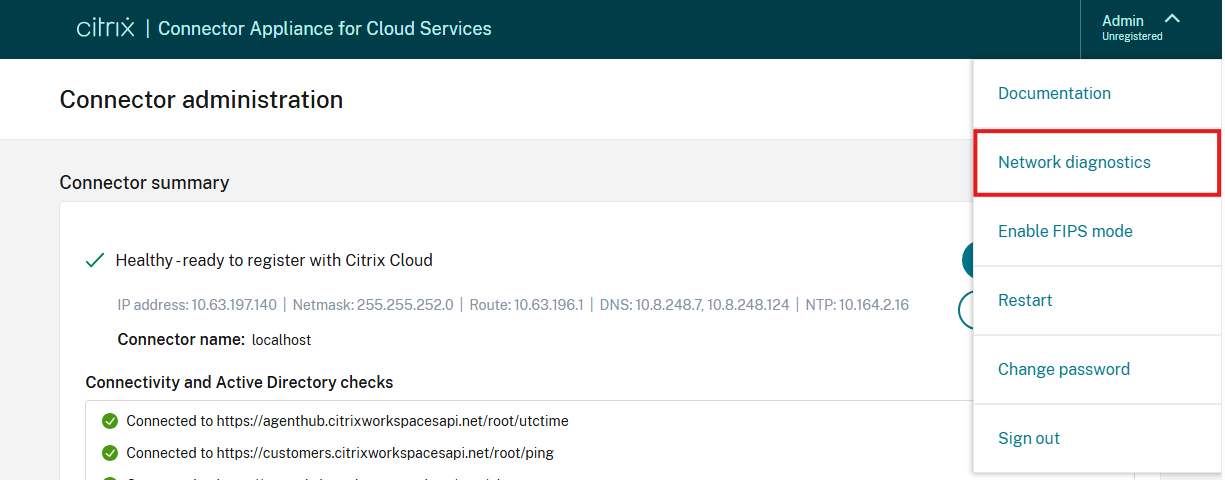
The network probe user interface can be accessed from the Connector Appliance administrator interface by navigating to Network diagnostics in the menu in the top-right corner.
The following protocols are supported:
- ICMP (sending a ping request)
- TCP
- TLS
- HTTP
- HTTPS
Specifying a proxy
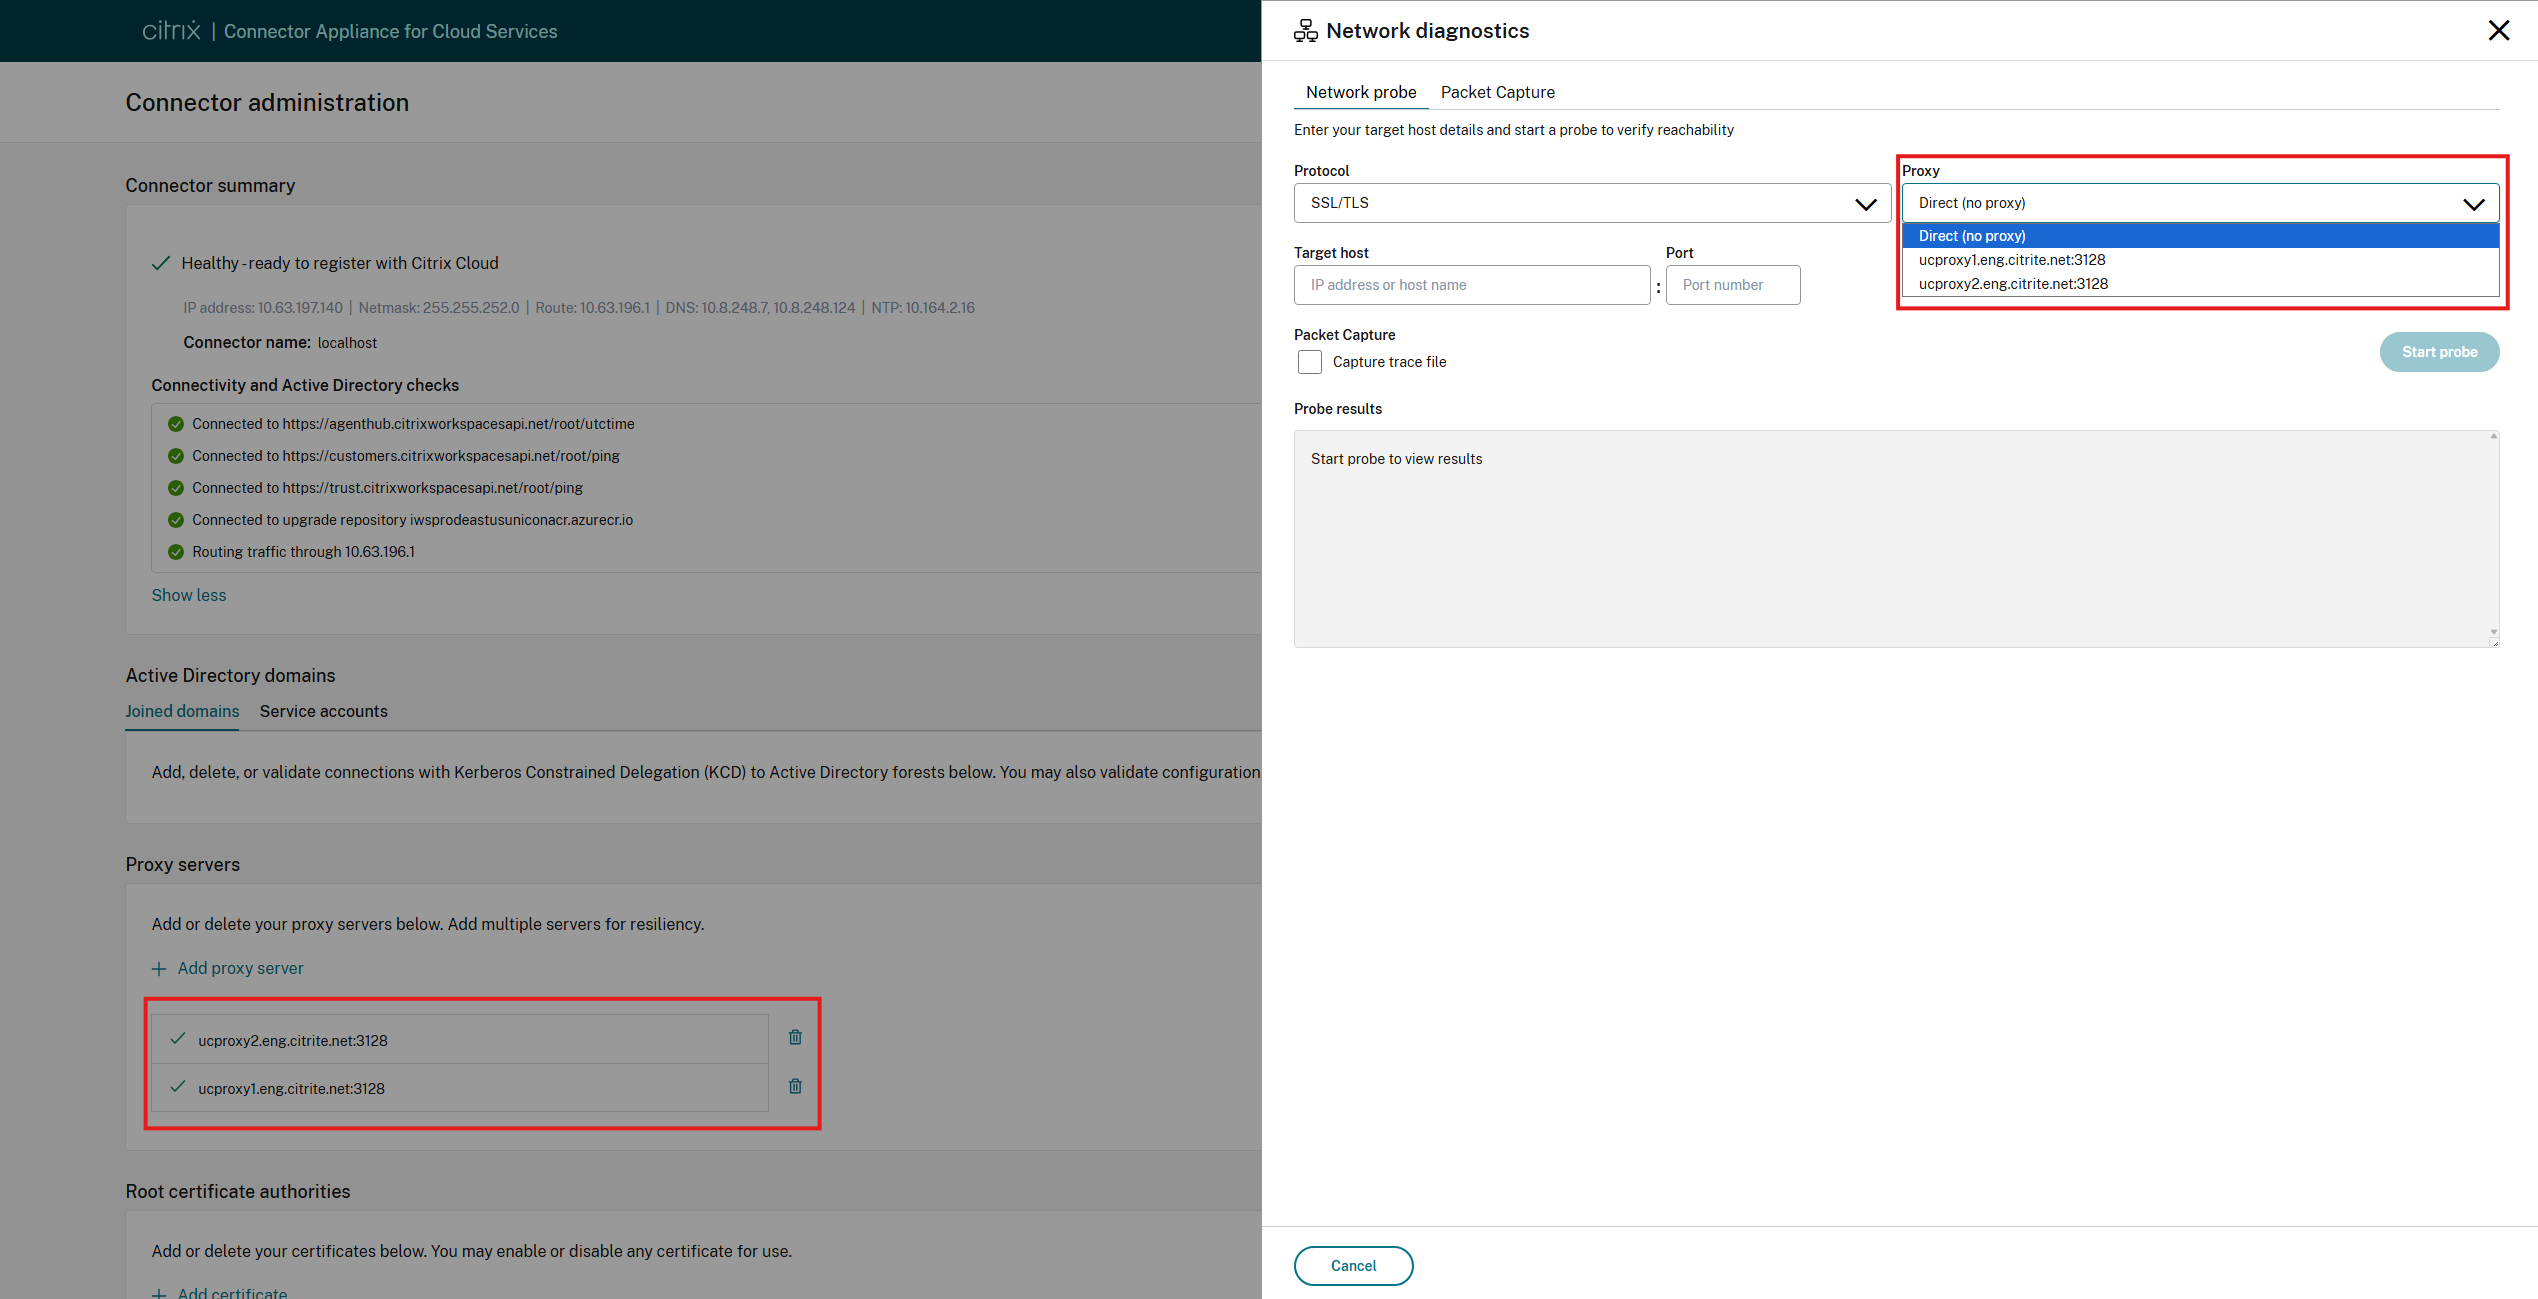
By default, the network probe will make a direct connection to the specified target without a proxy.
The ICMP network probe never uses a proxy.
For the other protocols, one of the proxies configured on the Connector Appliance can be selected for the network probe using the Proxy dropdown. The network probe will then be performed through the selected proxy.
For the TCP, TLS, and HTTPS protocols, the proxy will be used as a HTTPS proxy, and the network probe will send an HTTP CONNECT request to the selected proxy to establish a connection to the specified network target.
If the HTTP protocol is selected, the proxy will be used as a plain HTTP proxy by the network probe.
Allowed network targets
Probing is allowed for all private network targets. For external, public network targets, only the domains listed under the Internet connectivity requirements section are permitted. Each of these domains is either owned by Citrix or belong to a service required for the operation of the Connector Appliance.
Packet capture
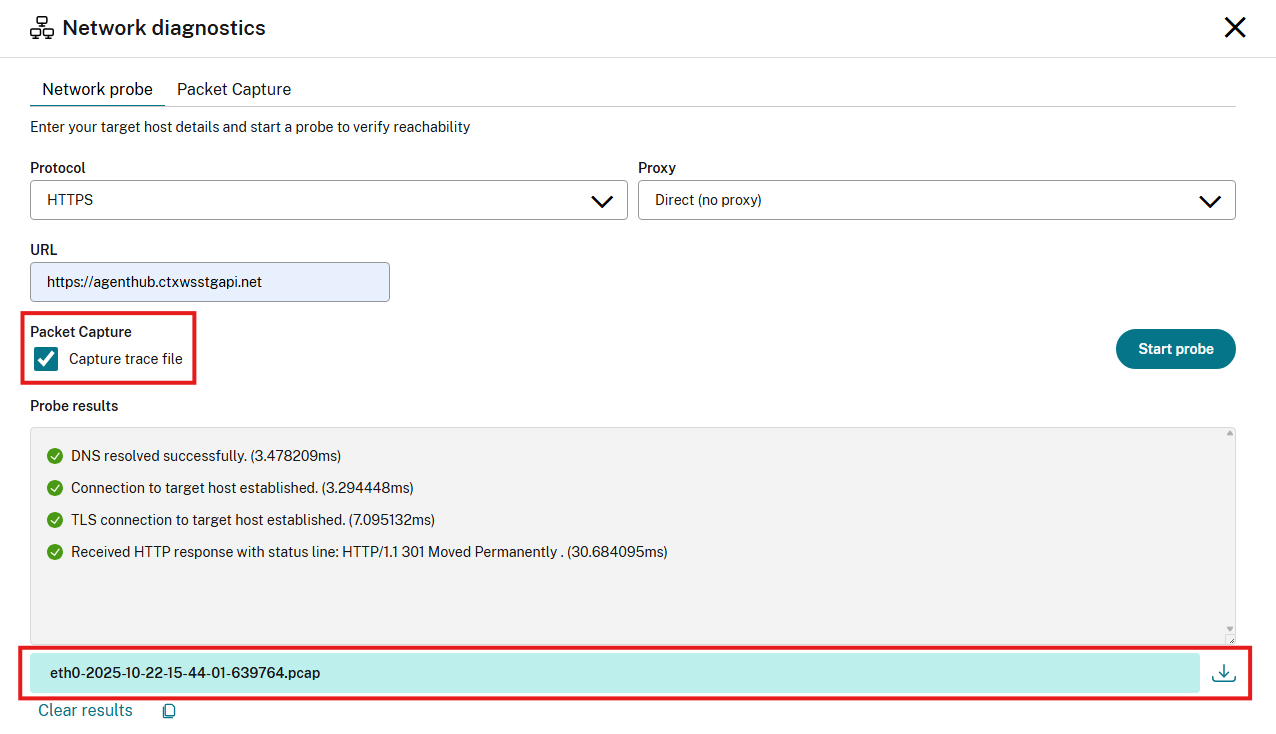
Packet tracing can be enabled for the duration of the network probe by ticking the Capture trace file checkbox. When the probe has finished, a link to a packet capture will be displayed under the probe Probe results. This packet trace file can help further diagnose the network probe result.
Note:
The packet trace captures all traffic on the Connector Appliance during the duration of the network probe, not just the traffic of the network probe itself. This may include sensitive data or credentials.
Network probe result
After clicking the Start probe button, the Probe results box will display the progress of the network probe. Information will be shown for each step of the network probe, such as DNS resolution, TCP connection, and so on. As the network probe progresses, the icon next to each network probe stage will indicate whether it is in progress, completed, or failed, and timing information and error details will be displayed for each step.
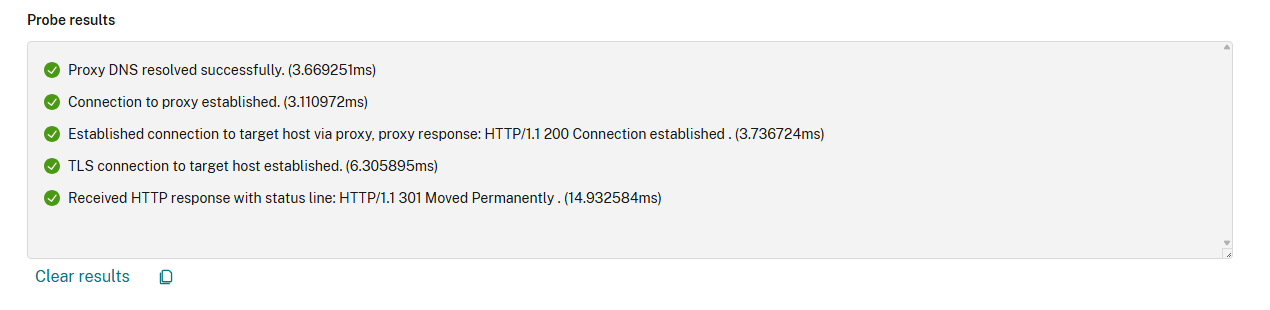
Interpreting the Result of HTTP-based Probes
HTTP and HTTPS network probes are marked as successful, as long as an HTTP response is received from the target URL, regardless of the HTTP status code returned. The HTTP status line of the response, including the HTTP response status code, will be displayed in the Probe results.
The same is true for a plain HTTP network probe when a proxy is selected. In this case, the selected proxy will be used as a plain HTTP proxy, and the probe will be considered successful as long as the proxy returns an HTTP response. An HTTP status line displayed in the Probe results with an error status code could indicate an error from the proxy or an error from the target URL.
Share
Share
This Preview product documentation is Citrix Confidential.
You agree to hold this documentation confidential pursuant to the terms of your Citrix Beta/Tech Preview Agreement.
The development, release and timing of any features or functionality described in the Preview documentation remains at our sole discretion and are subject to change without notice or consultation.
The documentation is for informational purposes only and is not a commitment, promise or legal obligation to deliver any material, code or functionality and should not be relied upon in making Citrix product purchase decisions.
If you do not agree, select I DO NOT AGREE to exit.