-
-
Cloud Connector Standalone Citrix Secure Ticketing Authority (STA) service
-
-
-
-
-
-
Troubleshooting with AOT and Log Server
-
-
This content has been machine translated dynamically.
Dieser Inhalt ist eine maschinelle Übersetzung, die dynamisch erstellt wurde. (Haftungsausschluss)
Cet article a été traduit automatiquement de manière dynamique. (Clause de non responsabilité)
Este artículo lo ha traducido una máquina de forma dinámica. (Aviso legal)
此内容已经过机器动态翻译。 放弃
このコンテンツは動的に機械翻訳されています。免責事項
이 콘텐츠는 동적으로 기계 번역되었습니다. 책임 부인
Este texto foi traduzido automaticamente. (Aviso legal)
Questo contenuto è stato tradotto dinamicamente con traduzione automatica.(Esclusione di responsabilità))
This article has been machine translated.
Dieser Artikel wurde maschinell übersetzt. (Haftungsausschluss)
Ce article a été traduit automatiquement. (Clause de non responsabilité)
Este artículo ha sido traducido automáticamente. (Aviso legal)
この記事は機械翻訳されています.免責事項
이 기사는 기계 번역되었습니다.책임 부인
Este artigo foi traduzido automaticamente.(Aviso legal)
这篇文章已经过机器翻译.放弃
Questo articolo è stato tradotto automaticamente.(Esclusione di responsabilità))
Translation failed!
Troubleshoot Common Issues with Always On Tracing
Applies to: Citrix Virtual Apps and Desktops 2402 CU4, 2507 CU1, 2511, 2603 and later, DaaS
Requires: AOT Log Server deployed; AuthKey configured in Director or Monitor settings
Always On Tracing (AOT) captures logs continuously across all Citrix components — VDAs, Delivery Controllers, StoreFront, License Server, and Citrix Workspace App. When a problem is reported, the data is already there. This article shows how to use the Logs node in Citrix Director or Monitor to identify the cause of an issue and how to export logs from Director or Monitor for submission to Citrix Technical Support.
Before you start — collect this for every scenario
- Affected user or machine — a specific username, VDA hostname, or delivery group name
- Time of failure — even an approximate window helps narrow the default time filter. Adjust the time range to cover the period before the reported failure.
- Scope — one user, one machine, or environment-wide? Scope alone often points to the correct failure pattern before you open a log
- Recent changes — any CVAD updates, Group Policy changes, power management changes, or network changes in the relevant window
The Logs node in Director and Monitor
The Logs node is available in both Citrix Director (on-premises CVAD) and Citrix Monitor (DaaS). To access it, select Logs from the left navigation panel. The interface is the same in both environments.
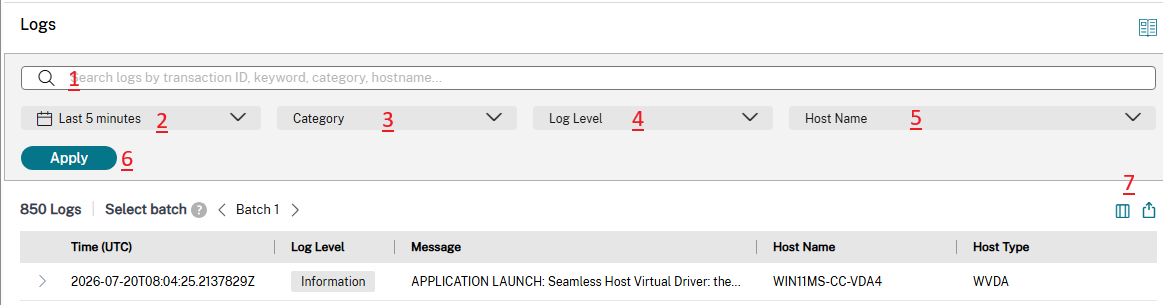
- Search bar — keyword, transaction ID, category, or hostname
- Time filter — select the window that covers the failure
- Category filter — filter by event type
- Log Level filter — filter by severity
- Host Name filter — select one or more machines
- Apply button — applies all active filter selections
- Export icon — download logs to submit to Citrix Technical Support
Filter bar
The filter bar has four filters and a separate Apply button. Set the filters first, then click Apply to refresh the log view. The current log count appears below the filter bar — for example, 850 Logs in Batch 1. Use the batch navigation arrows to page through large result sets.
| Filter | What it does | Options |
|---|---|---|
| Time | Sets the time window for log retrieval. Set this to a window that starts before the reported failure to capture the events that led up to it. | Last 5 minutes · Last 1 hour · Last 24 hours · Last 48 hours · Last 7 days · Custom (UTC) (CVAD 2603 and later cloud release only) |
| Category | Filters by event type. Each category corresponds to a specific part of the Citrix component lifecycle. Includes a Search Category field to quickly find a category by name. | Application Launch · Clipboard · CWA-PostLaunch · CWA-PreLaunch · Database · Devices · and more |
| Log Level | Filters by severity. Select one or more. When a selection is active, the button label shows the number selected (for example, 1 Log Level Selected). | Information · Warning · Error · Critical |
| Host Name | Filters to one or more specific machines. Includes a Search Host field and a checkbox list of all machines currently sending logs to the Log Server. When active, shows N Hostname Selected. | All machines registered with the Log Server |
| Log Level | When to use it |
|---|---|
| Information | Standard component events — session started, VDA registered, license checked out. Use to see the full lifecycle sequence. |
| Warning | Non-critical issues that may indicate a problem — session disconnects, idle timeouts, heartbeat warnings. Start here for disconnect scenarios. |
| Error | Failures requiring investigation — launch errors, registration failures, license exhaustion. Start here for most scenarios. |
| Critical | Severe failures affecting service — typically component crashes or unrecoverable states |
Log table — columns
The log table shows five columns by default for each entry. New columns can be added by clicking the Column button. Click the > expand arrow on any row to see the full log message and additional fields.
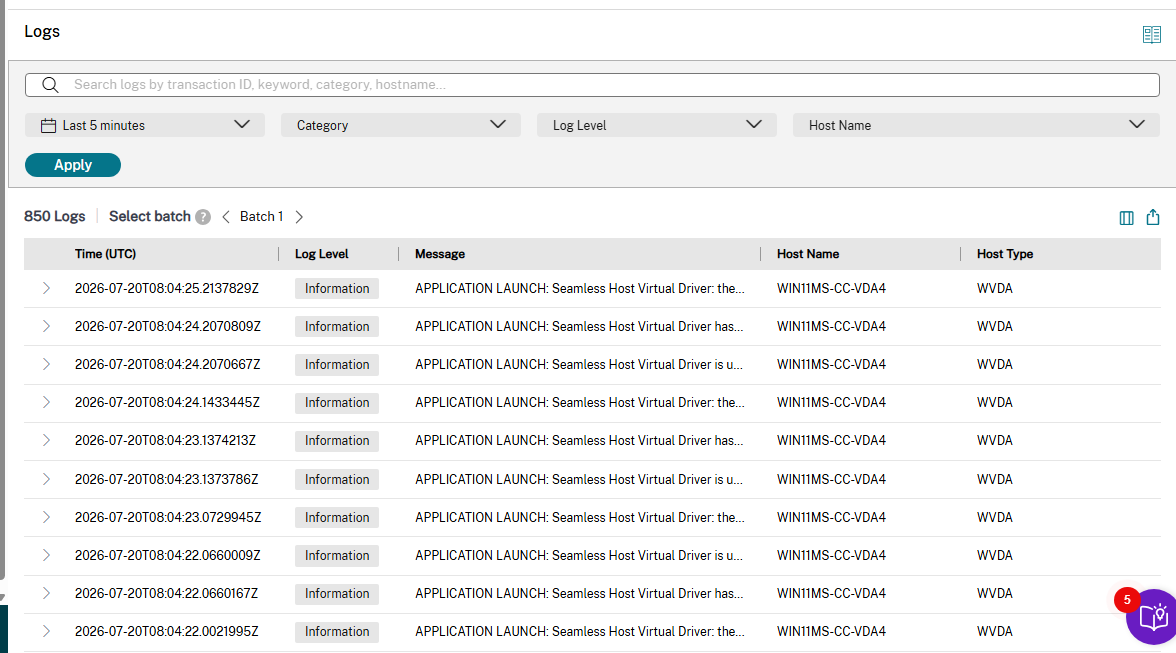
The Logs table with Application Launch category active. The log count and batch navigation appear above the table. Expand any row with the > arrow to read the full message.
| Column | What it shows |
|---|---|
| Time (UTC) | Timestamp of the event in UTC, with millisecond precision. Sort ascending to read a sequence of events in the order they occurred. |
| Log Level | Severity badge: Information, Warning, Error, or Critical |
| Message | The log message from the component. Truncated in the table — click the > expand arrow on the row to read the full message. The full message is the primary diagnostic text. |
| Host Name | The machine that generated the log entry |
| Host Type | The component type: DDC, StoreFront, WVDA (Windows VDA), CWAWindows, and others depending on what is registered with the Log Server |
Exporting logs for Citrix Technical Support
The export icon (7 in the annotated screenshot above) appears at the top right of the Logs section. Use it to download the current filtered log view as a file. Before exporting:
Version availability:
The export icon is available on DaaS from the Cloud 129 (April–May 2026) release and later, and on Citrix Virtual Apps and Desktops from CVAD 2603 and later. The option is not available on earlier versions.
AuthKey required:
The Logs node only shows data if the AuthKey is configured in Director or Monitor settings. The AuthKey is generated during Log Server setup. Without it, the Logs node shows no entries.
Scenario 1: Session launch failure
A user clicks a published desktop or application and gets a launch error. The session never opens. The error may appear on the Citrix Workspace App screen or the progress bar stalls and times out with no session connecting.
In the Logs node, set Category to Application Launch, Log Level to Error, and adjust Time to cover the failure window. Click Apply. Sort by Time (UTC) ascending and read the Message and Host Type columns together — they show which component in the launch path failed and what it reported.
Reference only:
The log messages below are illustrative examples. Actual messages in your environment follow the same format and column structure but may differ in exact wording.
Example: No VDA available in the delivery group
The DDC received the launch request but could not assign a desktop. All VDAs in the delivery group were unregistered or at session capacity.
| Time (UTC) | Log Level | Message | Host Name | Host Type |
|---|---|---|---|---|
| 2026-07-20T09:14:22.1034Z | Information | APPLICATION LAUNCH: User DOMAIN\jsmith requested Desktop from delivery group ‘Windows 11 VDAs’ | DDC-01 | DDC |
| 2026-07-20T09:14:22.3841Z | Error | APPLICATION LAUNCH: No suitable desktop found — all VDAs in delivery group ‘Windows 11 VDAs’ are unregistered or at session capacity | DDC-01 | DDC |
| 2026-07-20T09:14:22.4102Z | Error | APPLICATION LAUNCH: Launch failed for user DOMAIN\jsmith — no resources available | STF-01 | StoreFront |
The Error from DDC tells you the broker could not find an available VDA. Check VDA registration in Web Studio → Search Machines. See Scenario 2: VDA registration failure for VDA registration troubleshooting.
Example: VDA assigned but session initialization failed
The DDC assigned a VDA but the VDA could not start the session. Common causes: FSLogix or roaming profile container failure, Group Policy processing error, or VDA resource exhaustion.
| Time (UTC) | Log Level | Message | Host Name | Host Type |
|---|---|---|---|---|
| 2026-07-20T09:22:11.0234Z | Information | APPLICATION LAUNCH: VDA WIN11MS-CC-VDA4 selected for user DOMAIN\jsmith | DDC-01 | DDC |
| 2026-07-20T09:22:11.8820Z | Error | APPLICATION LAUNCH: Session initialization failed for user DOMAIN\jsmith — FSLogix profile container could not be mounted at \fileserver\profiles\jsmith.vhdx | WIN11MS-CC-VDA4 | WVDA |
| 2026-07-20T09:22:12.0011Z | Error | APPLICATION LAUNCH: Launch request failed — VDA WIN11MS-CC-VDA4 reported session preparation error for user DOMAIN\jsmith | DDC-01 | DDC |
The Error from Host Type WVDA identifies the VDA as the failure point and the Message shows the exact cause. Click the > expand arrow on that row to read the full message, which includes the full profile container path and error code.
Example: Virtual channel error during CWA post-launch
The session was created on the VDA side but the CWA client could not establish the ICA virtual channel connection. Filter Host Name to the CWA machine to see client-side errors.
| Time (UTC) | Log Level | Message | Host Name | Host Type |
|---|---|---|---|---|
| 2026-07-20T09:31:04.5521Z | Information | APPLICATION LAUNCH: Seamless Host Virtual Driver has been initialized successfully | WIN11MS-CC-VDA4 | WVDA |
| 2026-07-20T09:31:05.1204Z | Error | CWA-POSTLAUNCH::VIRTUAL CHANNEL: Failed to load virtual driver — channel negotiation timeout. Check firewall rules for ports 1494 and 2598. | Win22-CC-01 | CWAWindows |
Host Type CWAWindows with a CWA-POSTLAUNCH error means the VDA was ready but the ICA data path between client and VDA was blocked. Verify ports 1494 and 2598 are open from the client machine to the VDA.
Scenario 2: VDA registration failure
VDAs show as Unregistered in Director or Web Studio → Search Machines. Users see “No desktops are available to you at this time.” Published desktops appear greyed out in StoreFront or Citrix Workspace.
In the Logs node, set Category to VDA registration, Log Level to Error, and set Host Name to both the affected VDA and the DDC. Click Apply. Reading both sides of the registration handshake together — the VDA row and the DDC row at the same timestamp — shows exactly where the failure occurred.
Reference only:
The log messages below are illustrative examples. Actual messages in your environment follow the same format and column structure but may differ in exact wording.
Example: VDA cannot reach the Delivery Controller
The VDA is attempting to register but the DDC never receives the request. Only VDA-side errors appear — no matching DDC rows at the same timestamps.
| Time (UTC) | Log Level | Message | Host Name | Host Type |
|---|---|---|---|---|
| 2026-07-20T08:30:11.2341Z | Error | REGISTRATION: Failed to contact Delivery Controller DDC-01.domain.com on port 443 — connection timed out | WIN11MS-CC-VDA4 | WVDA |
| 2026-07-20T08:30:41.2341Z | Error | REGISTRATION: Failed to contact Delivery Controller DDC-01.domain.com on port 443 — connection timed out | WIN11MS-CC-VDA4 | WVDA |
| 2026-07-20T08:31:11.2341Z | Error | REGISTRATION: Failed to contact Delivery Controller DDC-01.domain.com on port 443 — connection timed out | WIN11MS-CC-VDA4 | WVDA |
The same error repeating at a fixed interval is a retry loop — the VDA is alive but blocked. Verify ports 80 and 443 are open from the VDA to the DDC, and check the ListOfDDCs registry key on the VDA for stale or incorrect DDC addresses.
Example: DDC rejects the registration request
The VDA reached the DDC but the DDC refused to register it. Both VDA and DDC rows appear — read the DDC Message for the rejection reason.
| Time (UTC) | Log Level | Message | Host Name | Host Type |
|---|---|---|---|---|
| 2026-07-20T08:30:11.2341Z | Information | REGISTRATION: VDA WIN11MS-CC-VDA4 attempting to register with DDC-01.domain.com | WIN11MS-CC-VDA4 | WVDA |
| 2026-07-20T08:30:11.8820Z | Error | REGISTRATION: Registration rejected — machine account WIN11MS-CC-VDA4$ is disabled or not found in Active Directory | DDC-01 | DDC |
The Error row comes from Host Type DDC — the DDC is the failure point, not the VDA. Click the > expand arrow on the DDC row to read the full rejection reason. Common reasons: disabled machine account in Active Directory, VDA/DDC version mismatch, or license pool exhaustion.
Example: VDA registers then immediately deregisters
Registration succeeds but the DDC initiates deregistration within seconds. This repeats in a loop. A power management drain policy is shutting the VDA down before it can accept sessions.
| Time (UTC) | Log Level | Message | Host Name | Host Type |
|---|---|---|---|---|
| 2026-07-20T09:01:33.1240Z | Information | REGISTRATION: VDA WIN11MS-CC-VDA4 registered successfully with DDC-01.domain.com | WIN11MS-CC-VDA4 | WVDA |
| 2026-07-20T09:01:47.4421Z | Error | POWER MANAGEMENT: PowerManagementDrain initiated — machine scheduled for shutdown by delivery group power policy | WIN11MS-CC-VDA4 | WVDA |
| 2026-07-20T09:01:47.6830Z | Error | REGISTRATION: VDA WIN11MS-CC-VDA4 deregistered — reason: power management drain | DDC-01 | DDC |
The 14-second gap between registration and deregistration is the tell. Check Web Studio → Delivery Group → Power Management for a drain or shutdown schedule that is applying during business hours.
Note:
The scenarios in this article are examples of how to search and investigate logs in Citrix Director or Monitor. The same methodology applies to any Citrix-related issue you encounter — session failures, authentication errors, connectivity problems, VDA instability, or any other component-level issue. Set the right Category, Log Level, and Host Name filters, read the log sequence in Time (UTC) order, and expand individual rows to read the full Message. The component that logged the first error and what the Message says will point you to the root cause — regardless of the scenario.
Tip — DaaS customers with Citrix Aidrien access: Copy the error message from the AOT log and paste it directly into Citrix Aidrien. Aidrien will explain the error and provide recommended troubleshooting steps. This may not resolve every issue on its own, but it will narrow down the root cause and in many cases guide you to a fix — before you need to contact Citrix Technical Support.
Escalating to Citrix Technical Support
If self-service investigation does not resolve the issue, include the following when opening a support ticket:
-
Exported log file covering the failure window — use the export icon described in option 7 above. You can export in two ways depending on what you have:
- Targeted export — apply Time, Category, and Host Name filters, then export. This gives Support a focused log set scoped to the failure.
- Broad export — apply only the Time filter and export without any other filters. This gives Support the full log picture for the failure window and is useful when the scope is unclear.
When the file downloads, the filename is prefixed with AOT. Do not remove or rename this prefix. You can edit the portion of the filename that follows — but always retain AOT at the beginning.
- The failure pattern identified from the sections above
- CVAD version, component versions (VDA, DDC, StoreFront), and Log Server version
- The transaction ID or session ID of the failed event — searchable in the Logs node search bar using the placeholder: “Search logs by transaction ID, keyword, category, hostname”
Because AOT captures logs continuously and every entry includes Host Name, Host Type, and timestamp, Citrix Technical Support can begin analysis immediately without asking you to reproduce the issue or collect new traces.
Share
Share
This Preview product documentation is Citrix Confidential.
You agree to hold this documentation confidential pursuant to the terms of your Citrix Beta/Tech Preview Agreement.
The development, release and timing of any features or functionality described in the Preview documentation remains at our sole discretion and are subject to change without notice or consultation.
The documentation is for informational purposes only and is not a commitment, promise or legal obligation to deliver any material, code or functionality and should not be relied upon in making Citrix product purchase decisions.
If you do not agree, select I DO NOT AGREE to exit.