This content has been machine translated dynamically.
Dieser Inhalt ist eine maschinelle Übersetzung, die dynamisch erstellt wurde. (Haftungsausschluss)
Cet article a été traduit automatiquement de manière dynamique. (Clause de non responsabilité)
Este artículo lo ha traducido una máquina de forma dinámica. (Aviso legal)
此内容已经过机器动态翻译。 放弃
このコンテンツは動的に機械翻訳されています。免責事項
이 콘텐츠는 동적으로 기계 번역되었습니다. 책임 부인
Este texto foi traduzido automaticamente. (Aviso legal)
Questo contenuto è stato tradotto dinamicamente con traduzione automatica.(Esclusione di responsabilità))
This article has been machine translated.
Dieser Artikel wurde maschinell übersetzt. (Haftungsausschluss)
Ce article a été traduit automatiquement. (Clause de non responsabilité)
Este artículo ha sido traducido automáticamente. (Aviso legal)
この記事は機械翻訳されています.免責事項
이 기사는 기계 번역되었습니다.책임 부인
Este artigo foi traduzido automaticamente.(Aviso legal)
这篇文章已经过机器翻译.放弃
Questo articolo è stato tradotto automaticamente.(Esclusione di responsabilità))
Translation failed!
Autoscale™設定の有効性の分析
-
この機能を使用するには、DaaS > Home > Preview features で Autoscale Insights トグルを有効にします。有効にしてから Autoscale Insights が表示されるまでに約15分かかる場合があります。
-
先週のマシン使用状況に基づいて、Autoscale設定の有効性を分析できます。この分析を通じて、Autoscale設定の有効性に関する以下のインサイトを得ることができます。
-
過剰なプロビジョニングによる財政的無駄を特定します
- プロビジョニング不足によりユーザーエクスペリエンスが悪影響を受けているかどうかを判断します
- プロビジョニングされた容量がマシン使用状況と適切に整合していることを確認します
この目標を達成するには、次の手順に従います。
- Autoscaleが有効なデリバリーグループを選択します。
-
下部のペインで、Autoscale Insights タブをクリックします。
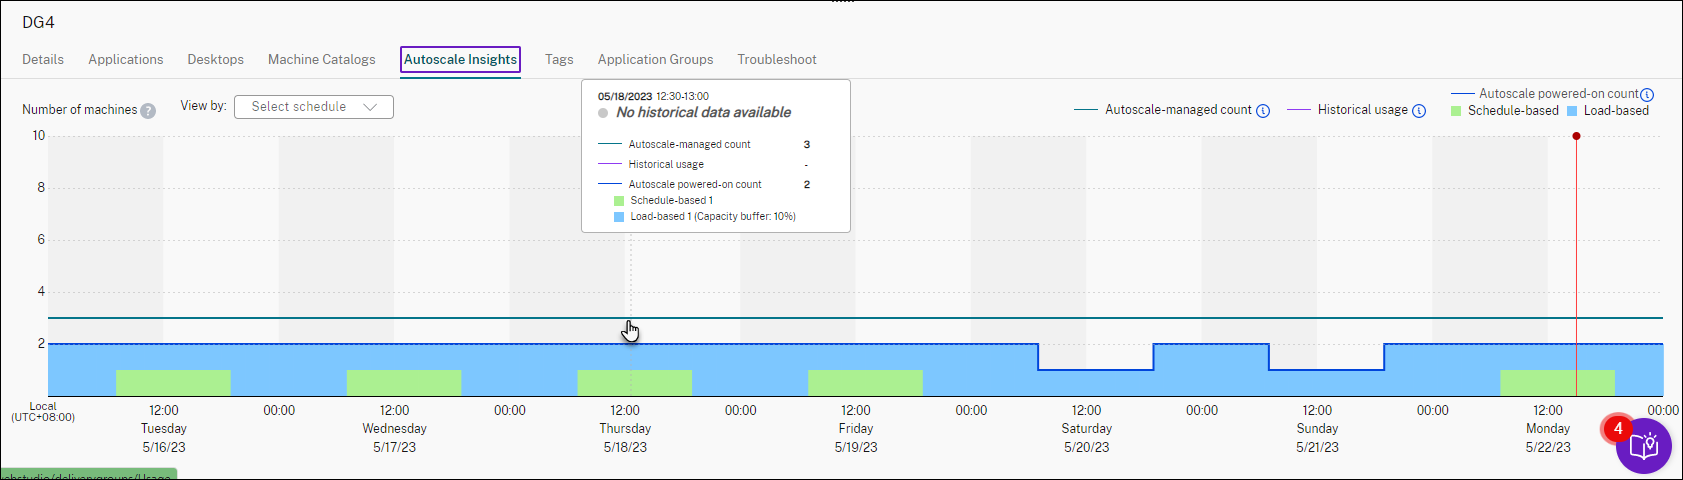
以下のグラフが表示され、先週のマシン使用状況データとAutoscale設定に基づいて電源がオンになるマシンの数が比較されます。
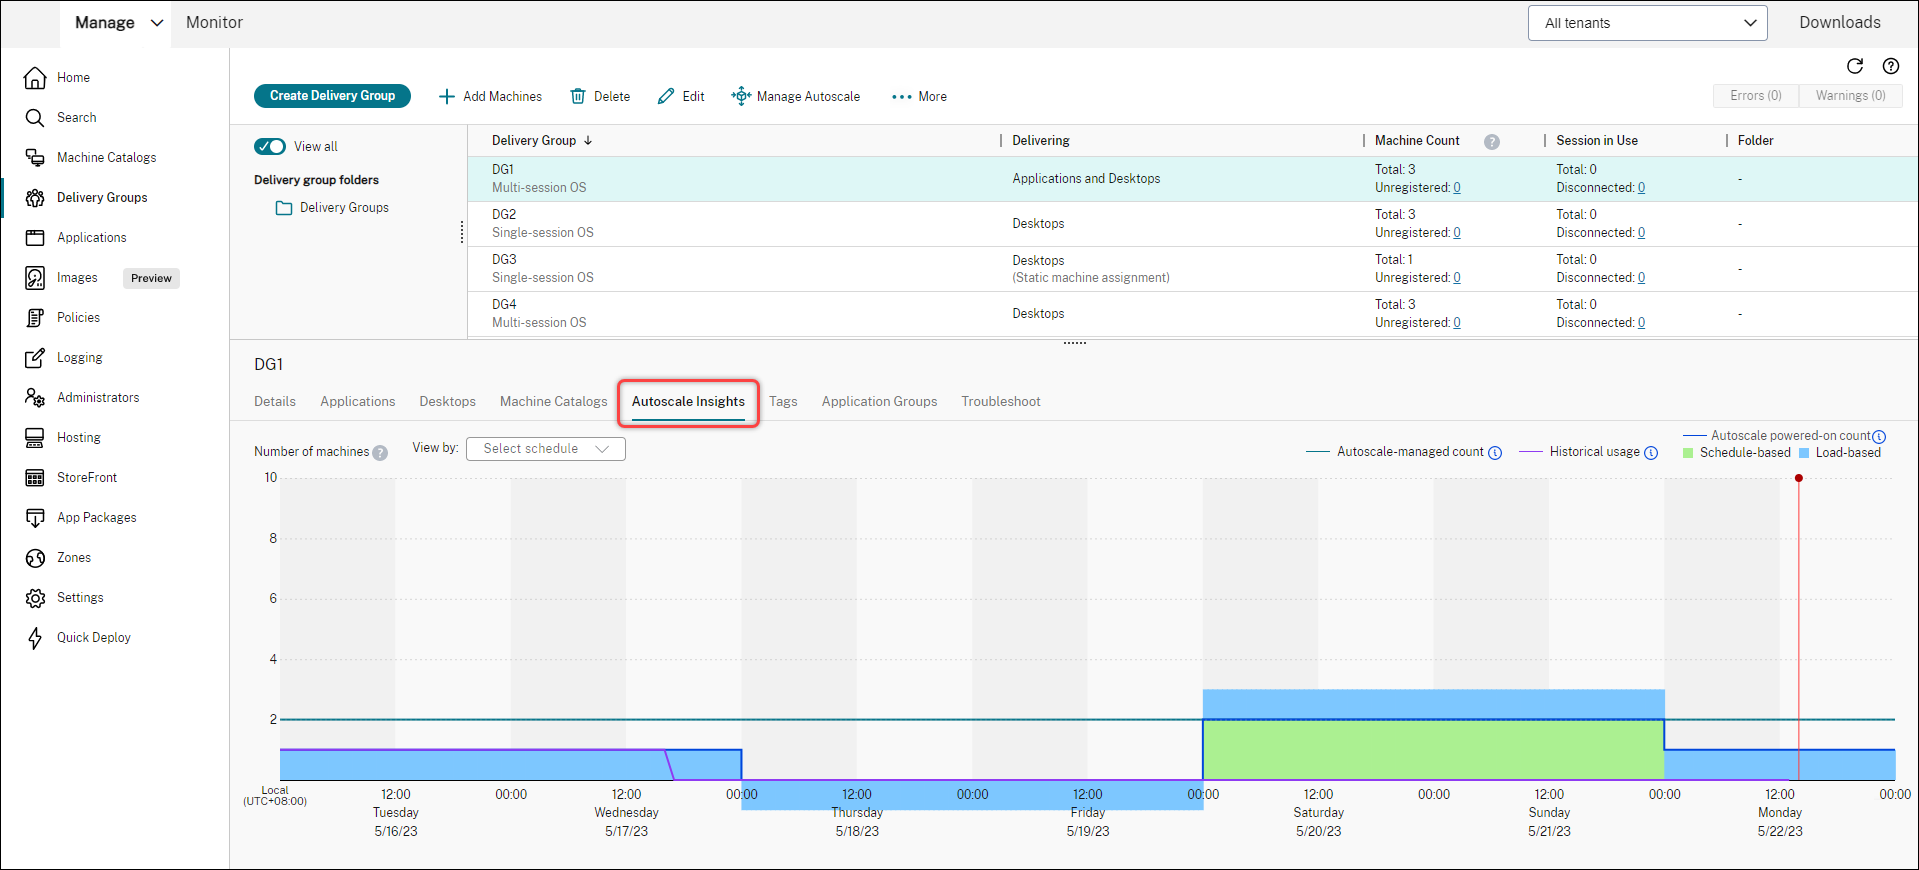
* 赤い垂直線は現在の時刻を示します。
以下の表は、このグラフに表示されるメトリックの説明を示します。
メトリック 説明 - | – | – |
Autoscale管理対象数 Autoscaleによって管理されるマシンの総数。Autoscale管理対象数 = デリバリーグループ内のマシンの総数 – メンテナンスモードのマシンの数 – Autoscale用にタグ付けされていないマシンの数 (タグ付けされたAutoscale機能が有効な場合)。 -
Autoscale電源オン数 Autoscaleによって電源がオンにされたマシンの総数。Autoscale電源オン数 = スケジュールベースのマシン数 + 負荷ベースのマシン数。
履歴使用状況 ユーザーに提供されたマシンの数。 スケジュールベース Autoscaleのスケジュールベース設定に基づいて電源がオンになるマシンの数(注: スケジュールベース設定は、静的シングルセッションOSタイプのデリバリーグループには適用されません)。 負荷ベース Autoscaleの負荷ベース設定に基づいて電源がオンになるマシンの数。 -
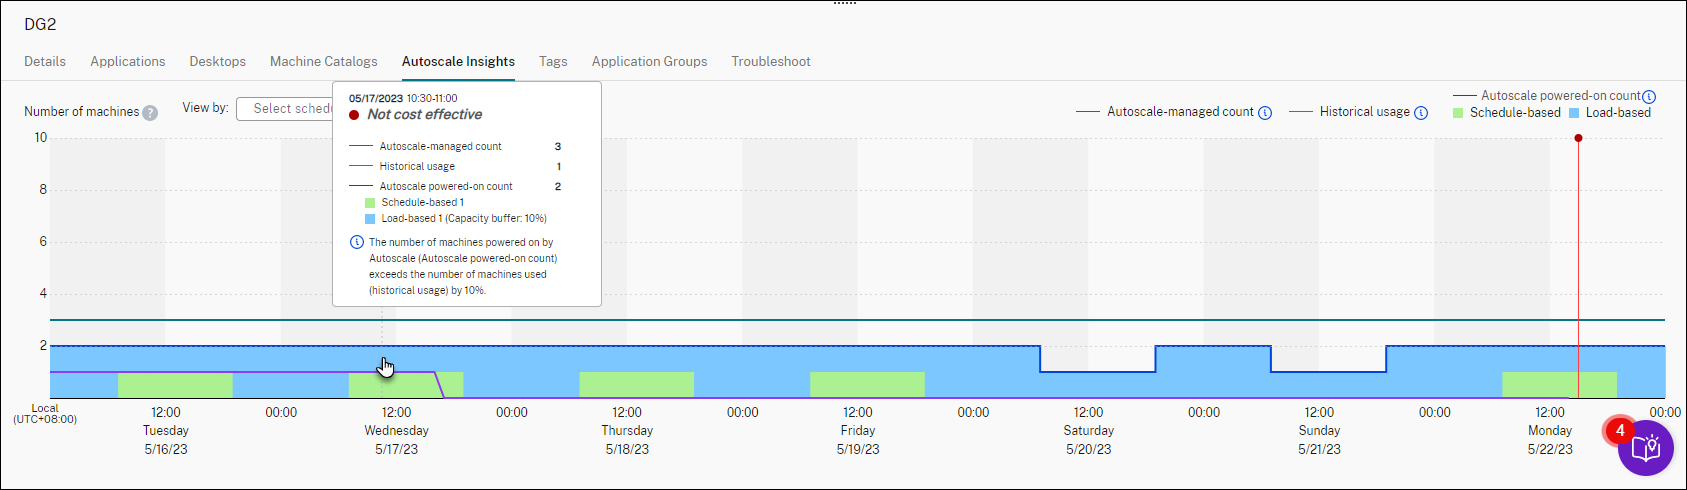
特定の時間帯におけるAutoscale設定の有効性を確認するには、グラフ上のその時間帯にマウスを合わせます。比較結果と詳細なマシン数が表示された情報ボックスが表示されます。
-
費用対効果が低い。履歴使用状況がAutoscale設定(Autoscale電源オン数)の90%未満です。その結果、無駄な容量が存在する可能性があります。
-
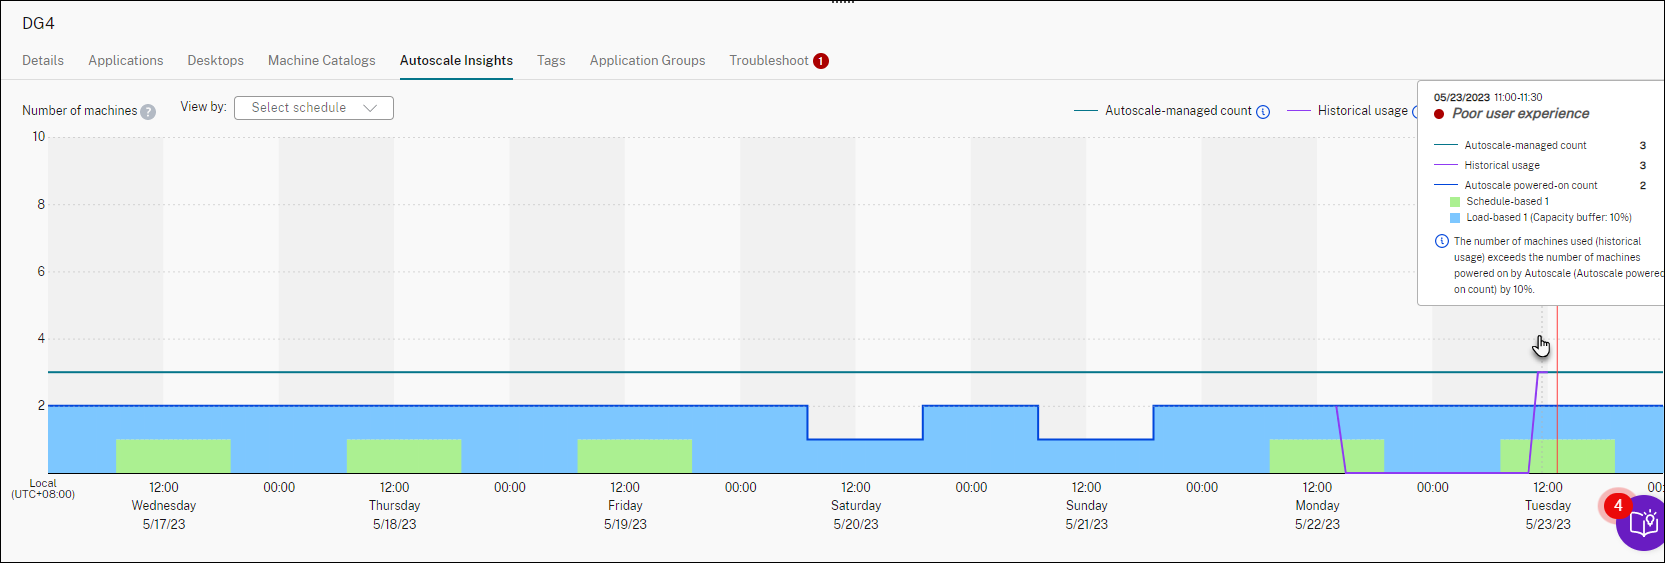
ユーザーエクスペリエンスが低い。履歴使用状況がAutoscale設定(Autoscale電源オン数)の110%を超えています。その結果、ユーザーはマシンの電源がオンになるまでの待ち時間が長くなる可能性があります。
-
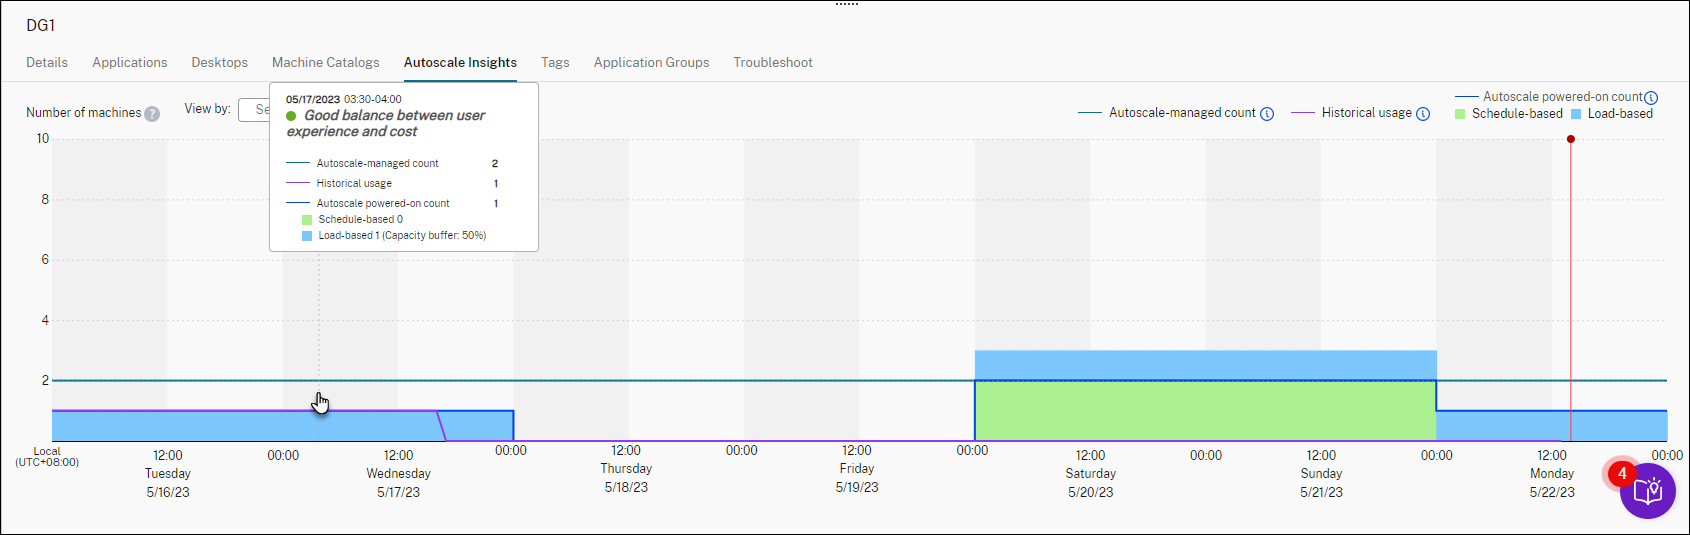
ユーザーエクスペリエンスとコストのバランスが良い。履歴使用状況とAutoscale設定(Autoscale電源オン数)の差が10%未満です。Autoscale設定は履歴使用状況と整合しています。
-
履歴データなし。履歴データがありません。考えられる原因として、Autoscaleがデリバリーグループに対して1週間未満前に有効にされたことなどが挙げられます。
-
-
Autoscaleスケジュールに基づいて日付範囲を強調表示するには、View by フィールドからスケジュールを選択します。
- 分析に基づいて、Autoscale設定を調整します。詳細については、「スケジュールベースおよび負荷ベースの設定」を参照してください。
共有
共有
この記事の概要
This Preview product documentation is Citrix Confidential.
You agree to hold this documentation confidential pursuant to the terms of your Citrix Beta/Tech Preview Agreement.
The development, release and timing of any features or functionality described in the Preview documentation remains at our sole discretion and are subject to change without notice or consultation.
The documentation is for informational purposes only and is not a commitment, promise or legal obligation to deliver any material, code or functionality and should not be relied upon in making Citrix product purchase decisions.
If you do not agree, select I DO NOT AGREE to exit.