This content has been machine translated dynamically.
Dieser Inhalt ist eine maschinelle Übersetzung, die dynamisch erstellt wurde. (Haftungsausschluss)
Cet article a été traduit automatiquement de manière dynamique. (Clause de non responsabilité)
Este artículo lo ha traducido una máquina de forma dinámica. (Aviso legal)
此内容已经过机器动态翻译。 放弃
このコンテンツは動的に機械翻訳されています。免責事項
이 콘텐츠는 동적으로 기계 번역되었습니다. 책임 부인
Este texto foi traduzido automaticamente. (Aviso legal)
Questo contenuto è stato tradotto dinamicamente con traduzione automatica.(Esclusione di responsabilità))
This article has been machine translated.
Dieser Artikel wurde maschinell übersetzt. (Haftungsausschluss)
Ce article a été traduit automatiquement. (Clause de non responsabilité)
Este artículo ha sido traducido automáticamente. (Aviso legal)
この記事は機械翻訳されています.免責事項
이 기사는 기계 번역되었습니다.책임 부인
Este artigo foi traduzido automaticamente.(Aviso legal)
这篇文章已经过机器翻译.放弃
Questo articolo è stato tradotto automaticamente.(Esclusione di responsabilità))
Translation failed!
Cloud Connector 高级健康检查 - 已弃用
注意:
Cloud Connector 健康指标和警报已添加到 Citrix DaaS™ 基础架构监控中。这应该是主动分析和排查基础架构相关问题的主要位置。
有关详细信息,请参阅基础架构监控。
在更新之前和之后,Cloud Connector 会执行健康检查,以确保更新不会给提供商造成不必要的停机时间。您可以在 Connector 上查看 Connector 以及每个服务或提供商的连接和健康状态。
查看 Connector 健康检查数据
- 从 Citrix Cloud™ 菜单中,选择 资源位置。
- 选择您要查看其健康检查数据的 Connector。
- 在“Connectors”页面上,转到 Connector 旁边的省略号菜单,然后选择 查看 Connector 数据。
“Connector 数据”页面随即显示,显示以下信息。
-
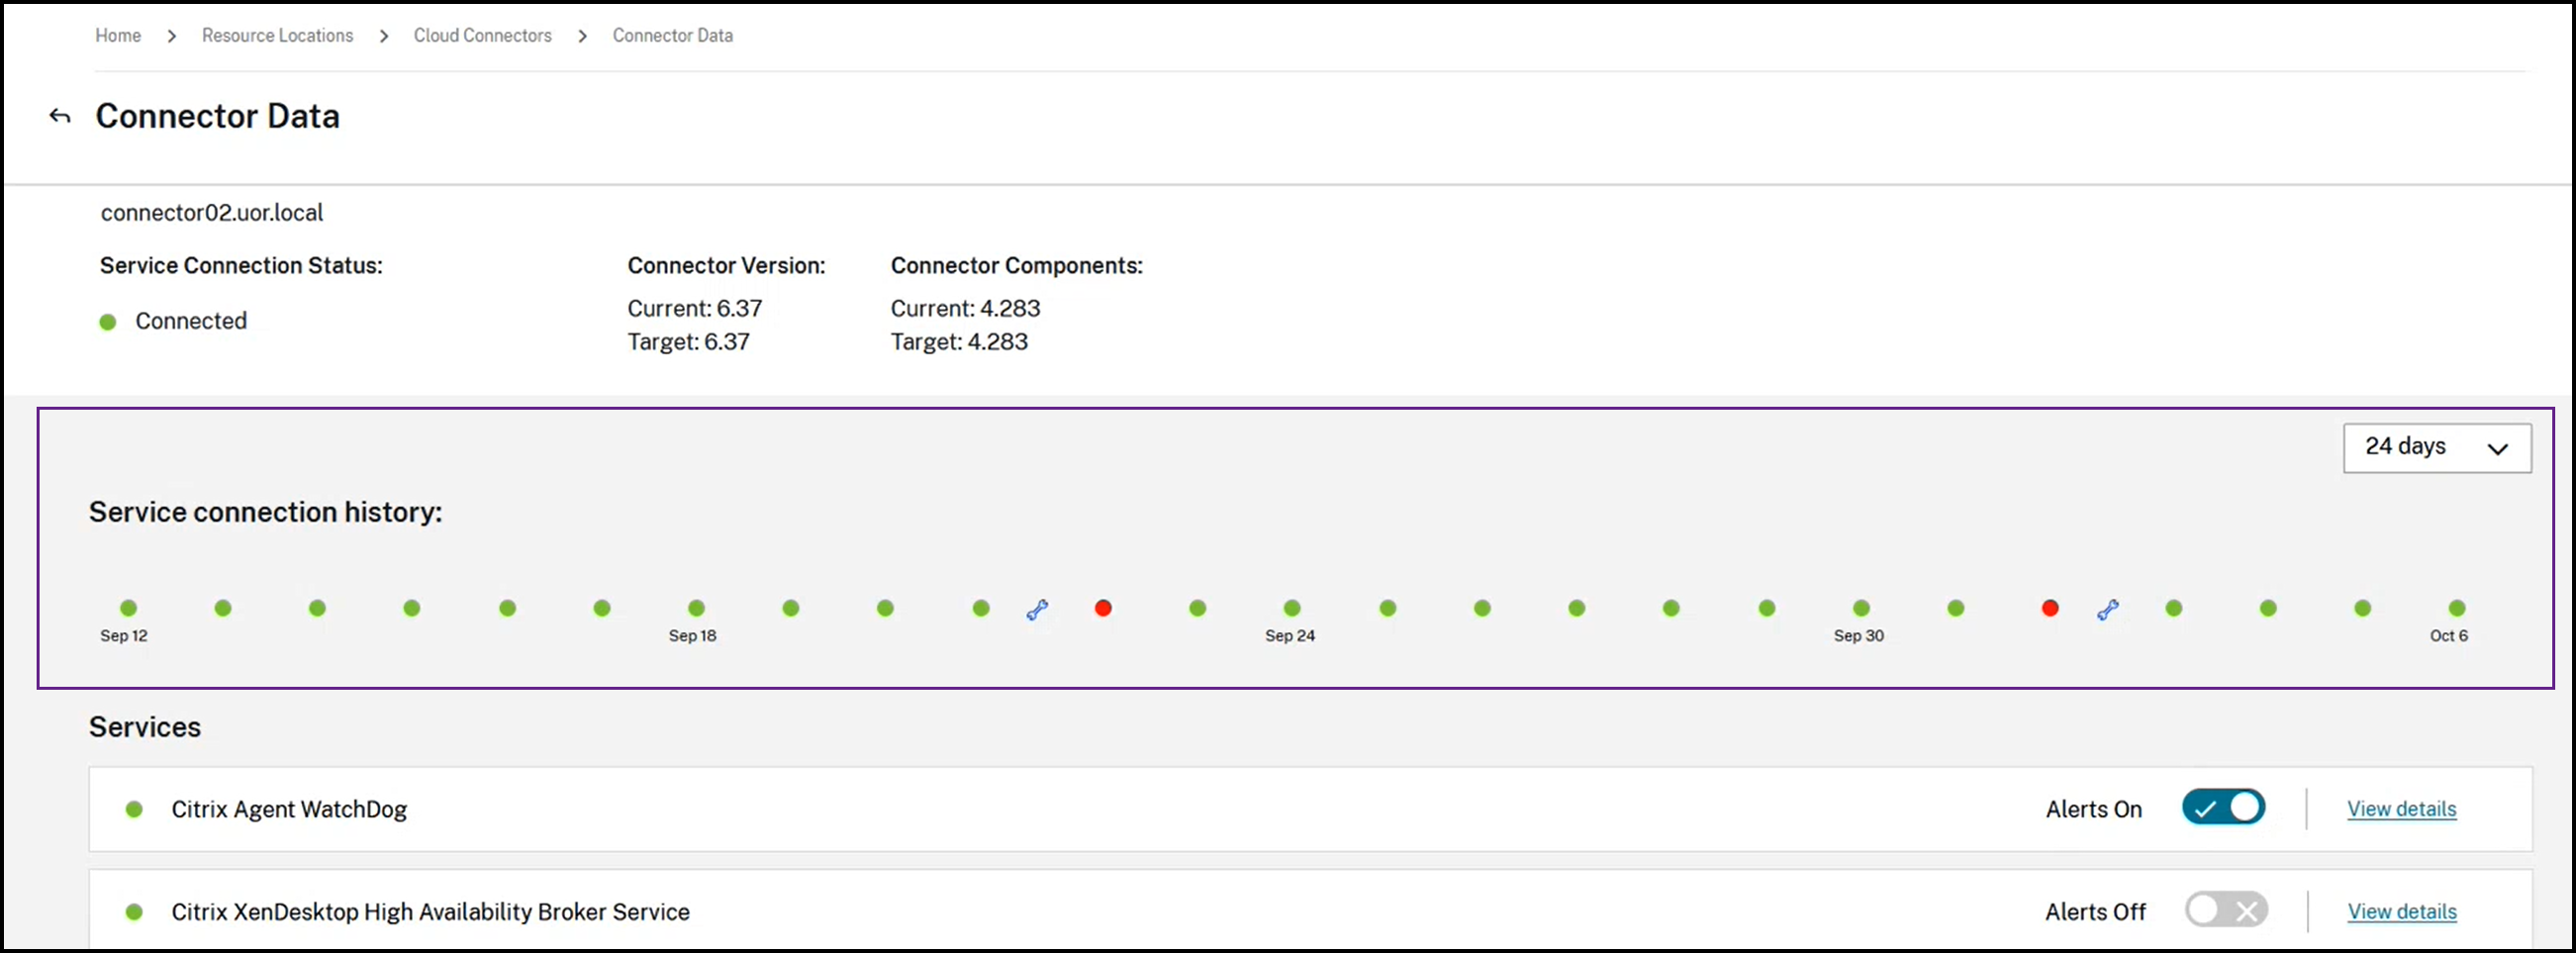
服务连接状态。Connector 数据页面的此区域显示:
-
您的 Connector 是否已连接到云
-
对于 Connector 及其组件,当前安装的版本以及下次更新中要安装的目标版本
-
-
服务连接历史记录。24 个状态指示器显示 Connector 随时间变化的健康状态。默认情况下,服务连接历史记录以一小时为间隔显示过去 24 小时的状态。要查看更多历史记录,请从下拉菜单中选择 24 天。该视图以一天为间隔显示过去 24 天的状态。
- 绿点表示在该时间间隔内的健康状态。
- 红点表示在该时间间隔内出现故障或异常状态。将鼠标悬停在点上可获取更多信息。
- 扳手图标表示在该时间间隔内发生了更新。将鼠标悬停在扳手图标上可获取更多信息。
- 灰点表示在该时间间隔内未收到任何运行状况信息。
-
服务。此区域列出了在连接器上运行的每个服务。
- 每个服务旁边的点表示该服务的当前状态。
- 使用警报开启和警报关闭来控制是否接收来自服务的警报通知。如果警报设置为“开启”,则服务中的故障会导致整个连接器连接状态失败。
- 选择查看详细信息以查看服务随时间变化的运行状况详细信息。
- 连接器指标。此区域显示连接器在过去 24 小时或 24 天内的内存使用情况、CPU、网络数据和磁盘空间使用情况。使用服务连接历史记录区域中的下拉菜单来控制显示的时间段。
查看服务详细信息
要查看每个服务的连接状态历史记录和指标:
-
使用服务连接历史记录部分中的下拉菜单选择时间段。您可以按一小时间隔查看过去 24 小时,或按一天间隔查看过去 24 天。
-
在“连接器数据”页面上,选择服务旁边的查看详细信息。
出现的页面显示:
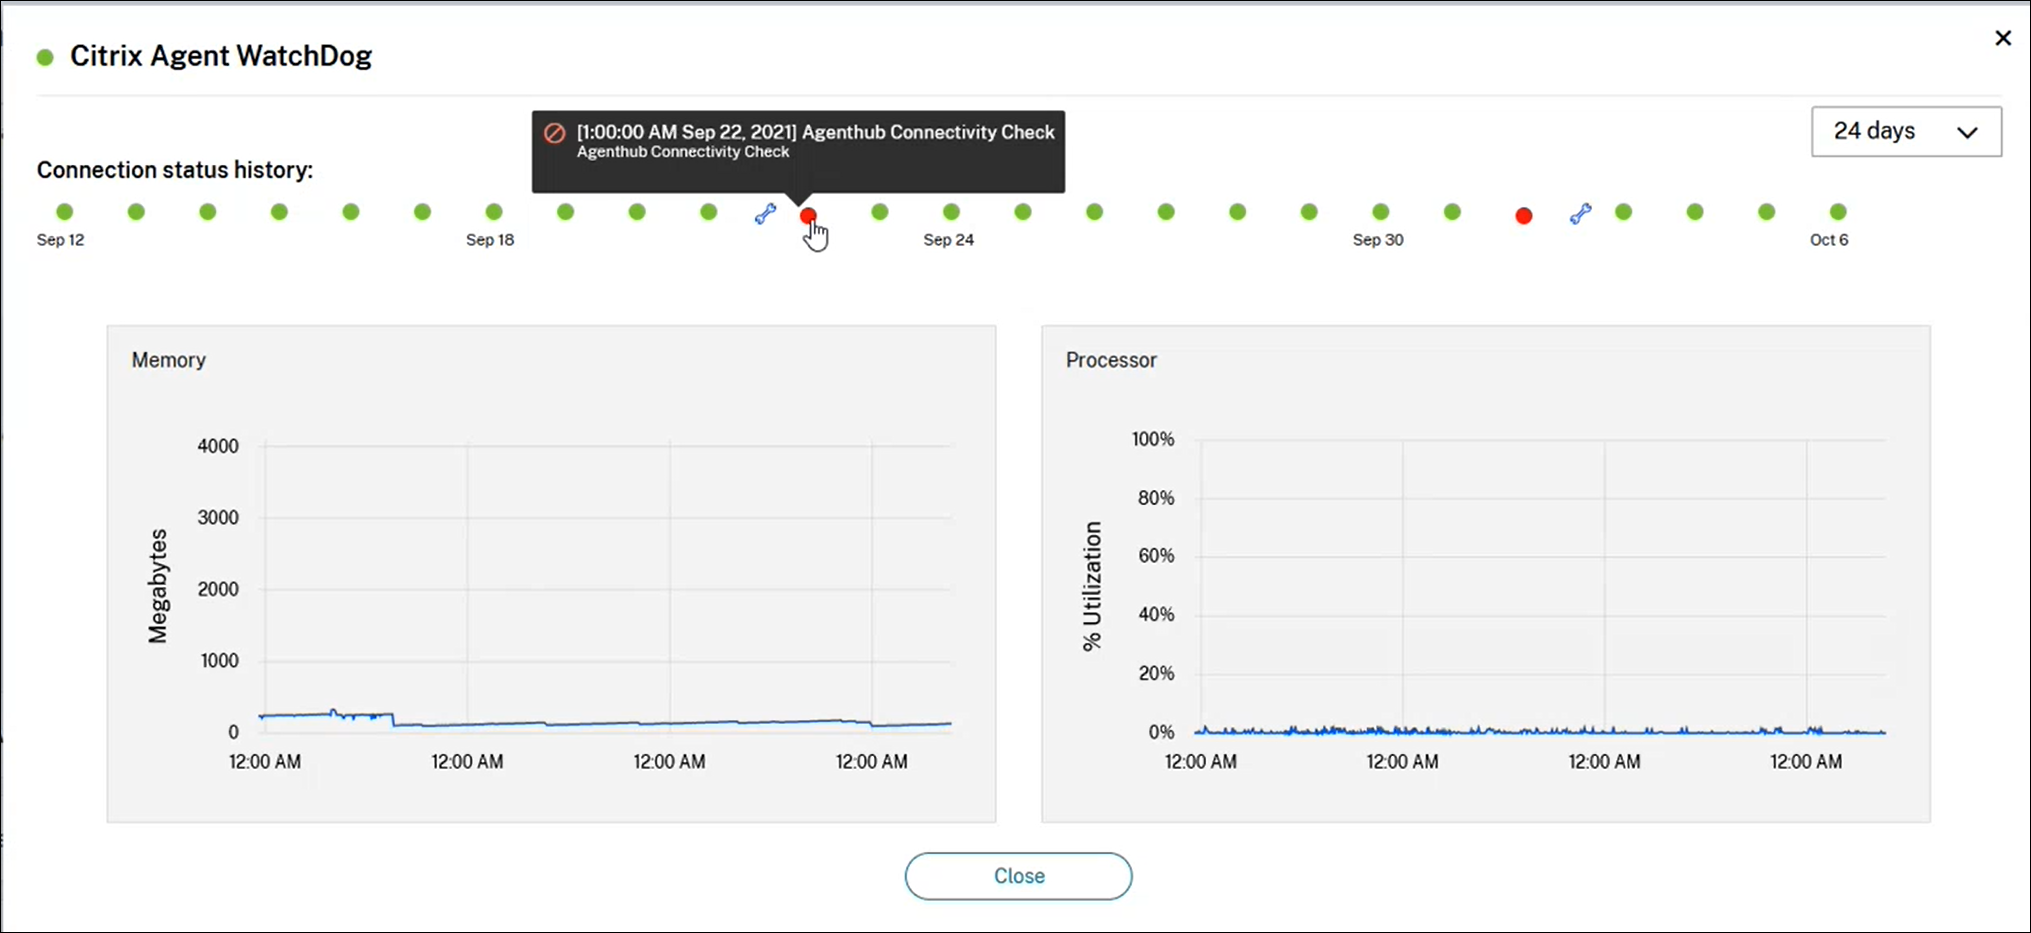
- 24 个状态指示器,显示服务随时间变化的运行状况。
- 绿点表示在此时间间隔内状态正常。
- 红点表示在此时间间隔内出现故障或异常状态。将鼠标悬停在圆点上可查看更多信息。
- 扳手图标表示在此时间间隔内发生了更新。将鼠标悬停在扳手图标上可查看更多信息。
- 灰点表示在此时间间隔内未收到运行状况信息。
-
显示服务在指定时间段内的内存和处理器使用情况的图表。
共享
共享
This Preview product documentation is Citrix Confidential.
You agree to hold this documentation confidential pursuant to the terms of your Citrix Beta/Tech Preview Agreement.
The development, release and timing of any features or functionality described in the Preview documentation remains at our sole discretion and are subject to change without notice or consultation.
The documentation is for informational purposes only and is not a commitment, promise or legal obligation to deliver any material, code or functionality and should not be relied upon in making Citrix product purchase decisions.
If you do not agree, select I DO NOT AGREE to exit.